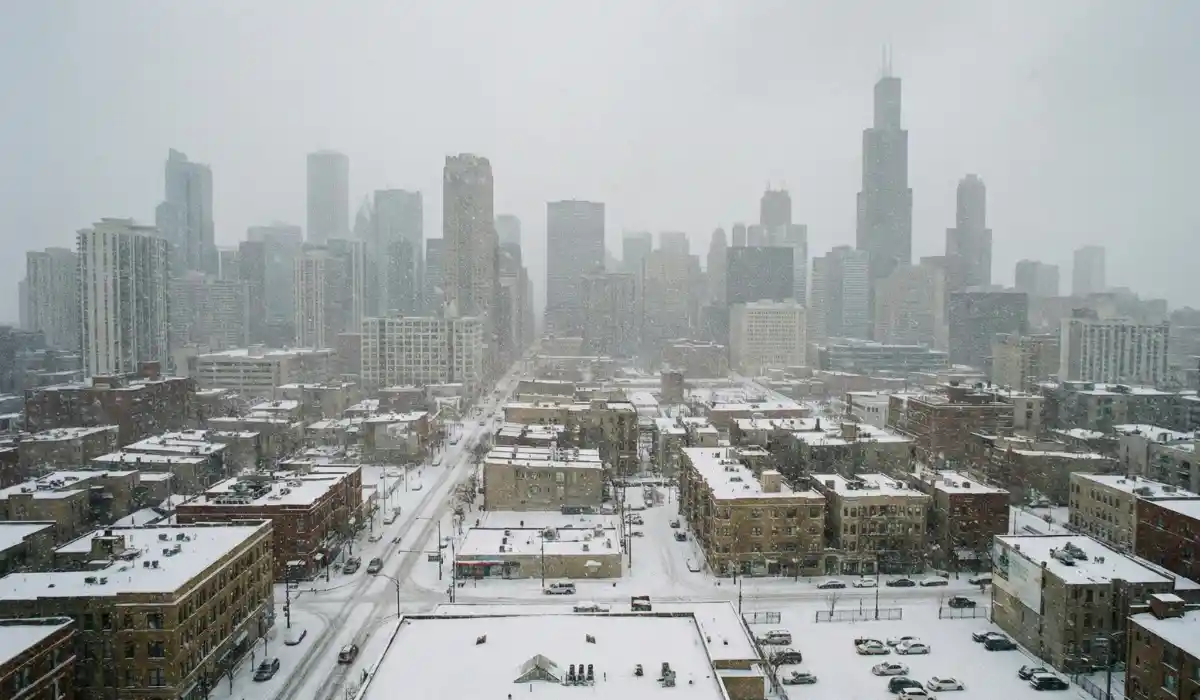
Top 10 Snowiest Cities in the U.S. Ranked by Annual Snowfall
The number one snowiest city in the US isn’t in New York. It isn’t in Minnesota, or Alaska, or anywhere most people would guess first.
It’s in Michigan’s Upper Peninsula, a city of roughly 20,000 people on the south shore of Lake Superior, getting buried under 117 inches of lake-effect snow every single year. And while it doesn’t get the national attention that Buffalo or Syracuse do, the data is pretty unambiguous about where it sits.
What is the snowiest city in the US? Marquette, Michigan. For large cities with 100,000 or more residents, that answer shifts to Syracuse, New York, which averages 114 inches annually. The distinction matters depending on what you’re looking for — and the list below covers both, along with eight other US cities that make everyone else’s winter look manageable.
All figures here come from NOAA weather station data cross-referenced with National Weather Service cooperative observer records. Town-level measurements only, not airport readings, not mountain summits, not the roof of a ski lodge.
How We Ranked These Cities
Every snowfall figure is drawn from NOAA National Centers for Environmental Information annual averages and cross-referenced with long-term city records and Golden Snow Globe contest historical data.
One note on Anchorage, Alaska, at #9: it’s included because it’s one of the most frequently searched cities for US snowfall comparisons, and it deserves accurate context. But if your question is specifically what is the snowiest city in the continental US, ,the 48 contiguous states the answer is Marquette, Michigan. Anchorage is not part of the continental United States.
10 Snowiest Cities In The U.S. You Must Know
1. Marquette, Michigan
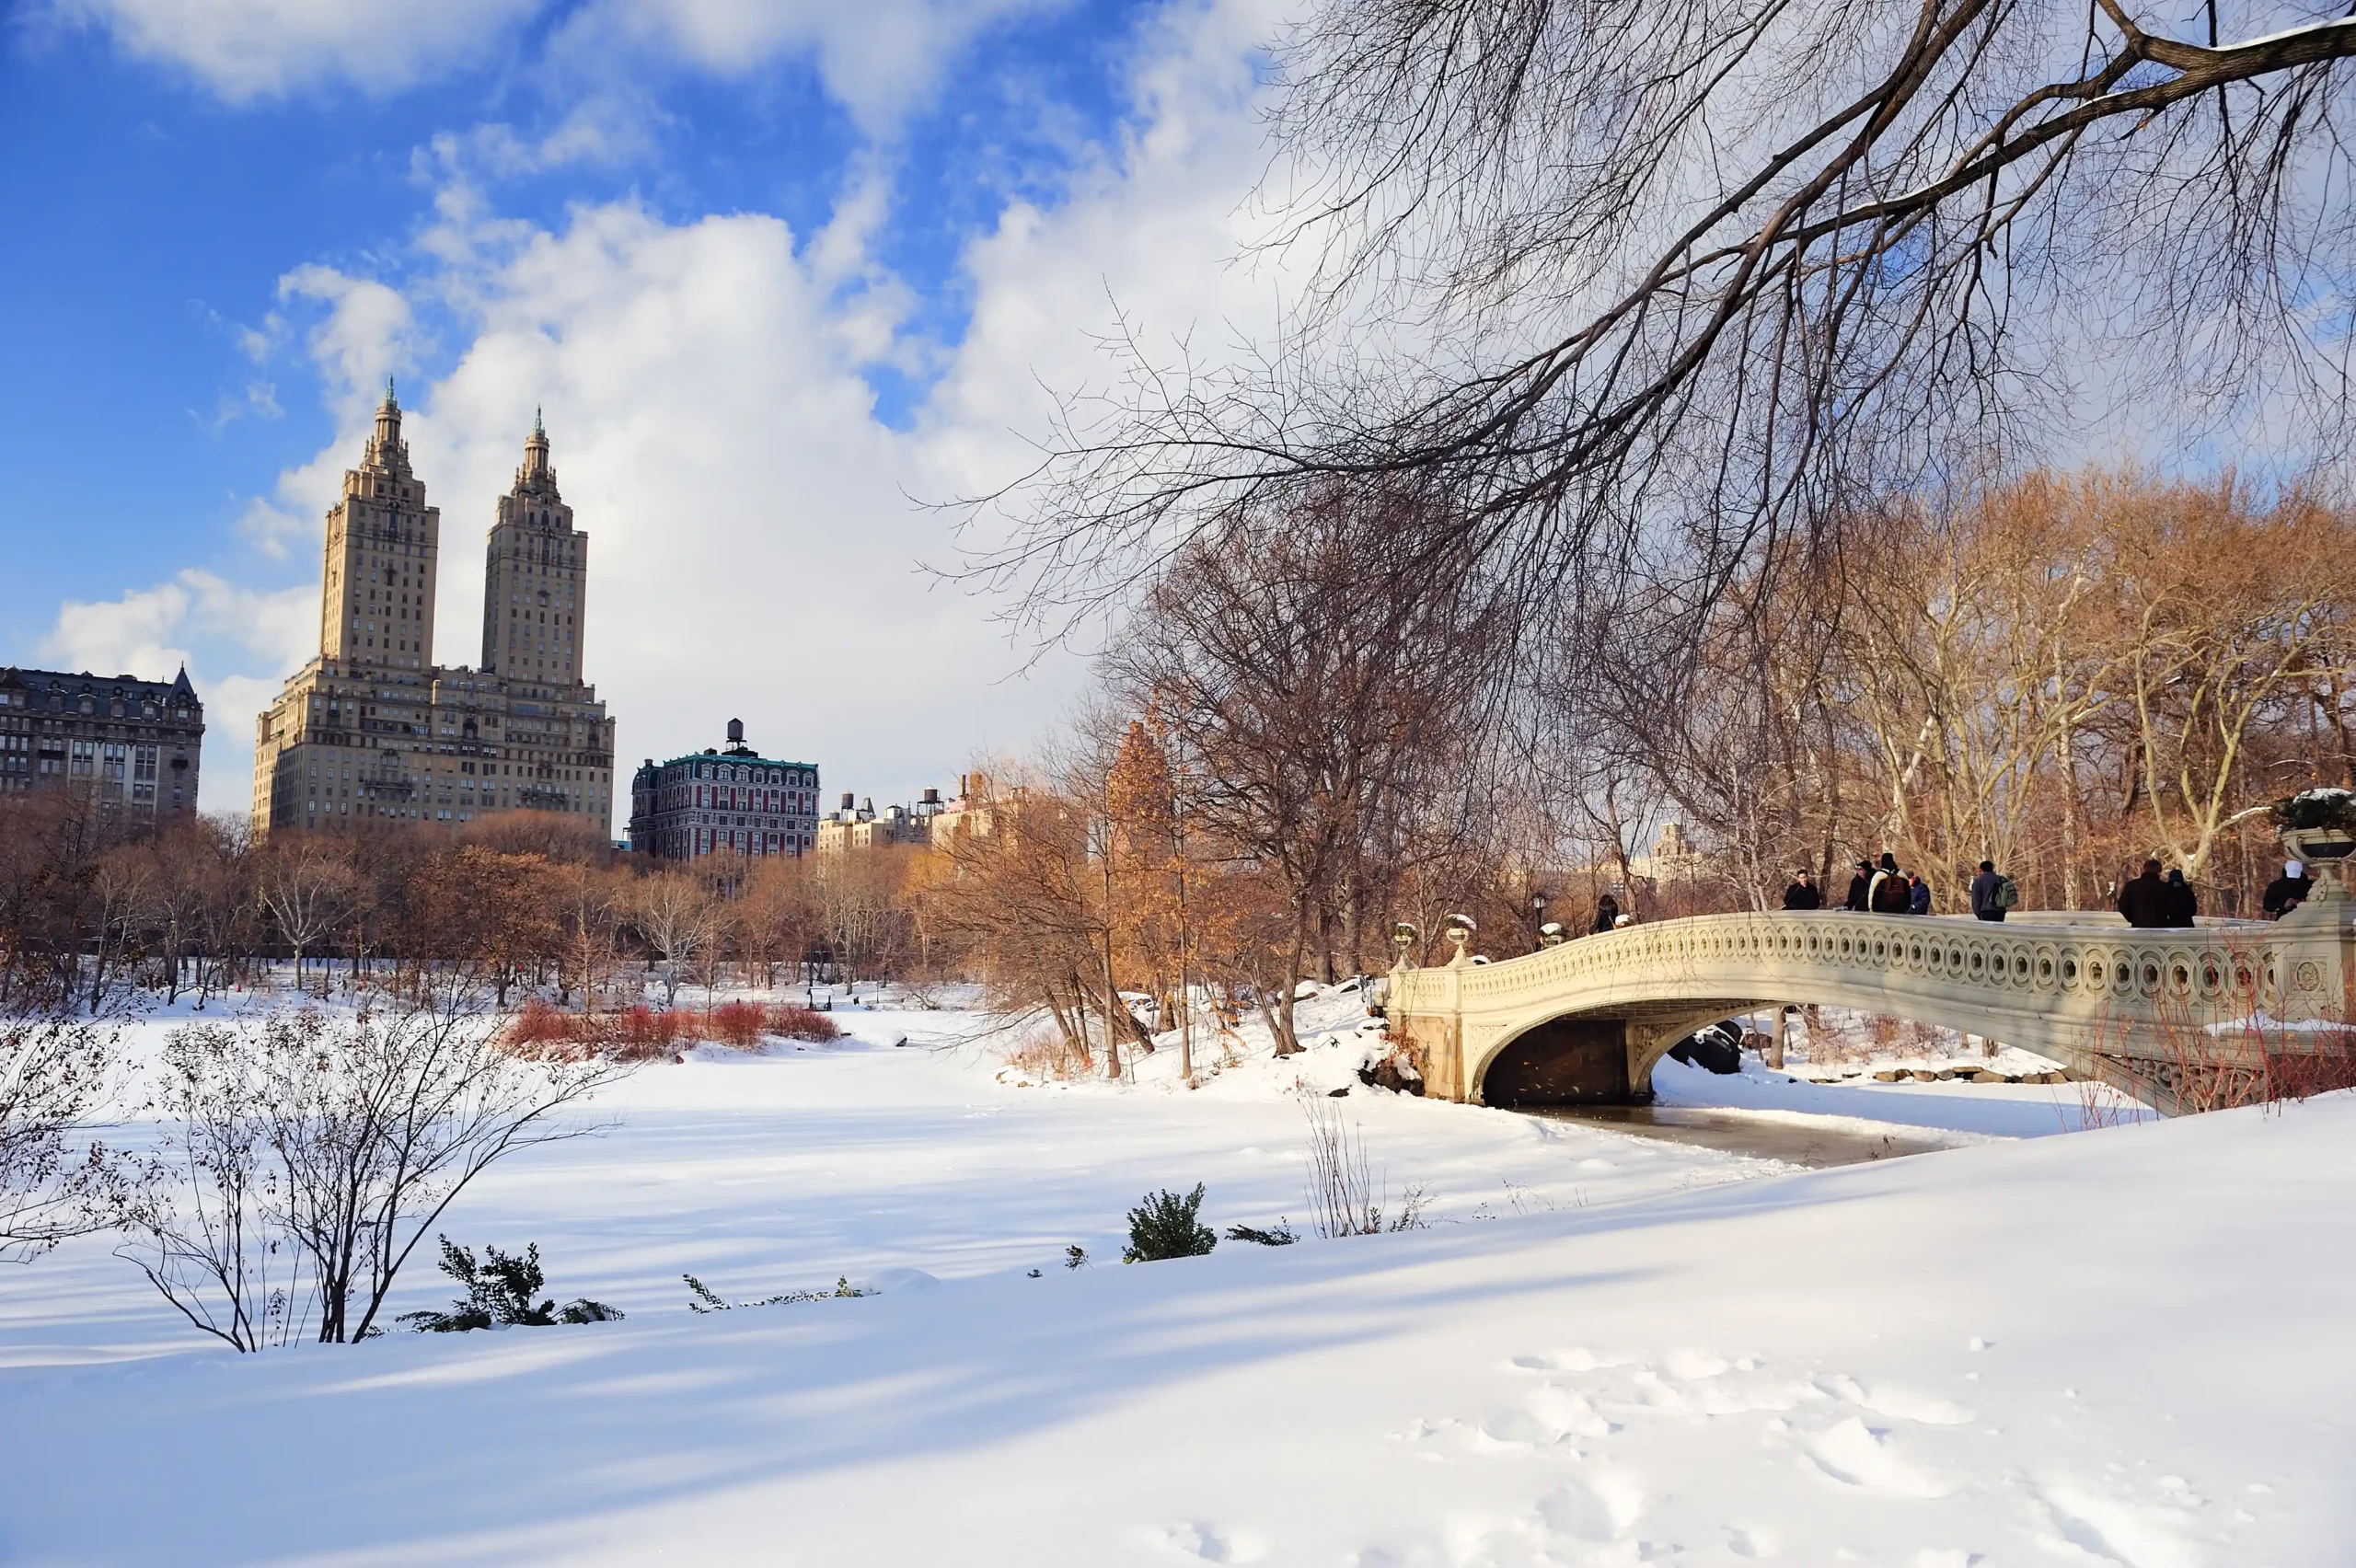
Marquette doesn’t get the national weather coverage it deserves. That’s partly because it’s a small city in a remote corner of Michigan’s Upper Peninsula, and partly because lake-effect snow events in Syracuse and Buffalo tend to generate more dramatic headlines when they happen. But the annual average is the annual average, and Marquette’s is 117 inches, which puts it ahead of every other city on this list.
The mechanism is Lake Superior. Marquette sits on the southern shore of the largest freshwater lake in the world by surface area, and cold arctic air masses moving southwest to northeast in a pattern that sets up reliably every winter travel across hundreds of miles of open water before slamming into the Michigan shoreline. That transit picks up heat and moisture. When the air mass hits land and is forced to rise, it dumps everything it’s carrying. November and December are the most explosive months, when Superior hasn’t yet frozen and storm systems can reload and return repeatedly over days.
What sets Marquette apart from other lake-effect cities is the consistency. It doesn’t depend on a few massive events to hit 117 inches; it accumulates steadily from October through May, with individual seasons regularly exceeding 150 inches. Locals don’t ask whether it’s going to be a heavy winter. They ask how heavy.
School closure decisions in Marquette are some of the most routine in the US. Districts here have pre-established storm thresholds and an administrative infrastructure built specifically for managing heavy, frequent snowfall. When a lake-effect band sets up overhead, the question isn’t whether schools will close it’s how quickly the call will come.
Snow season: October through May
Peak month: November–December
Closure risk: Very High
2. Sault Ste. Marie, Michigan
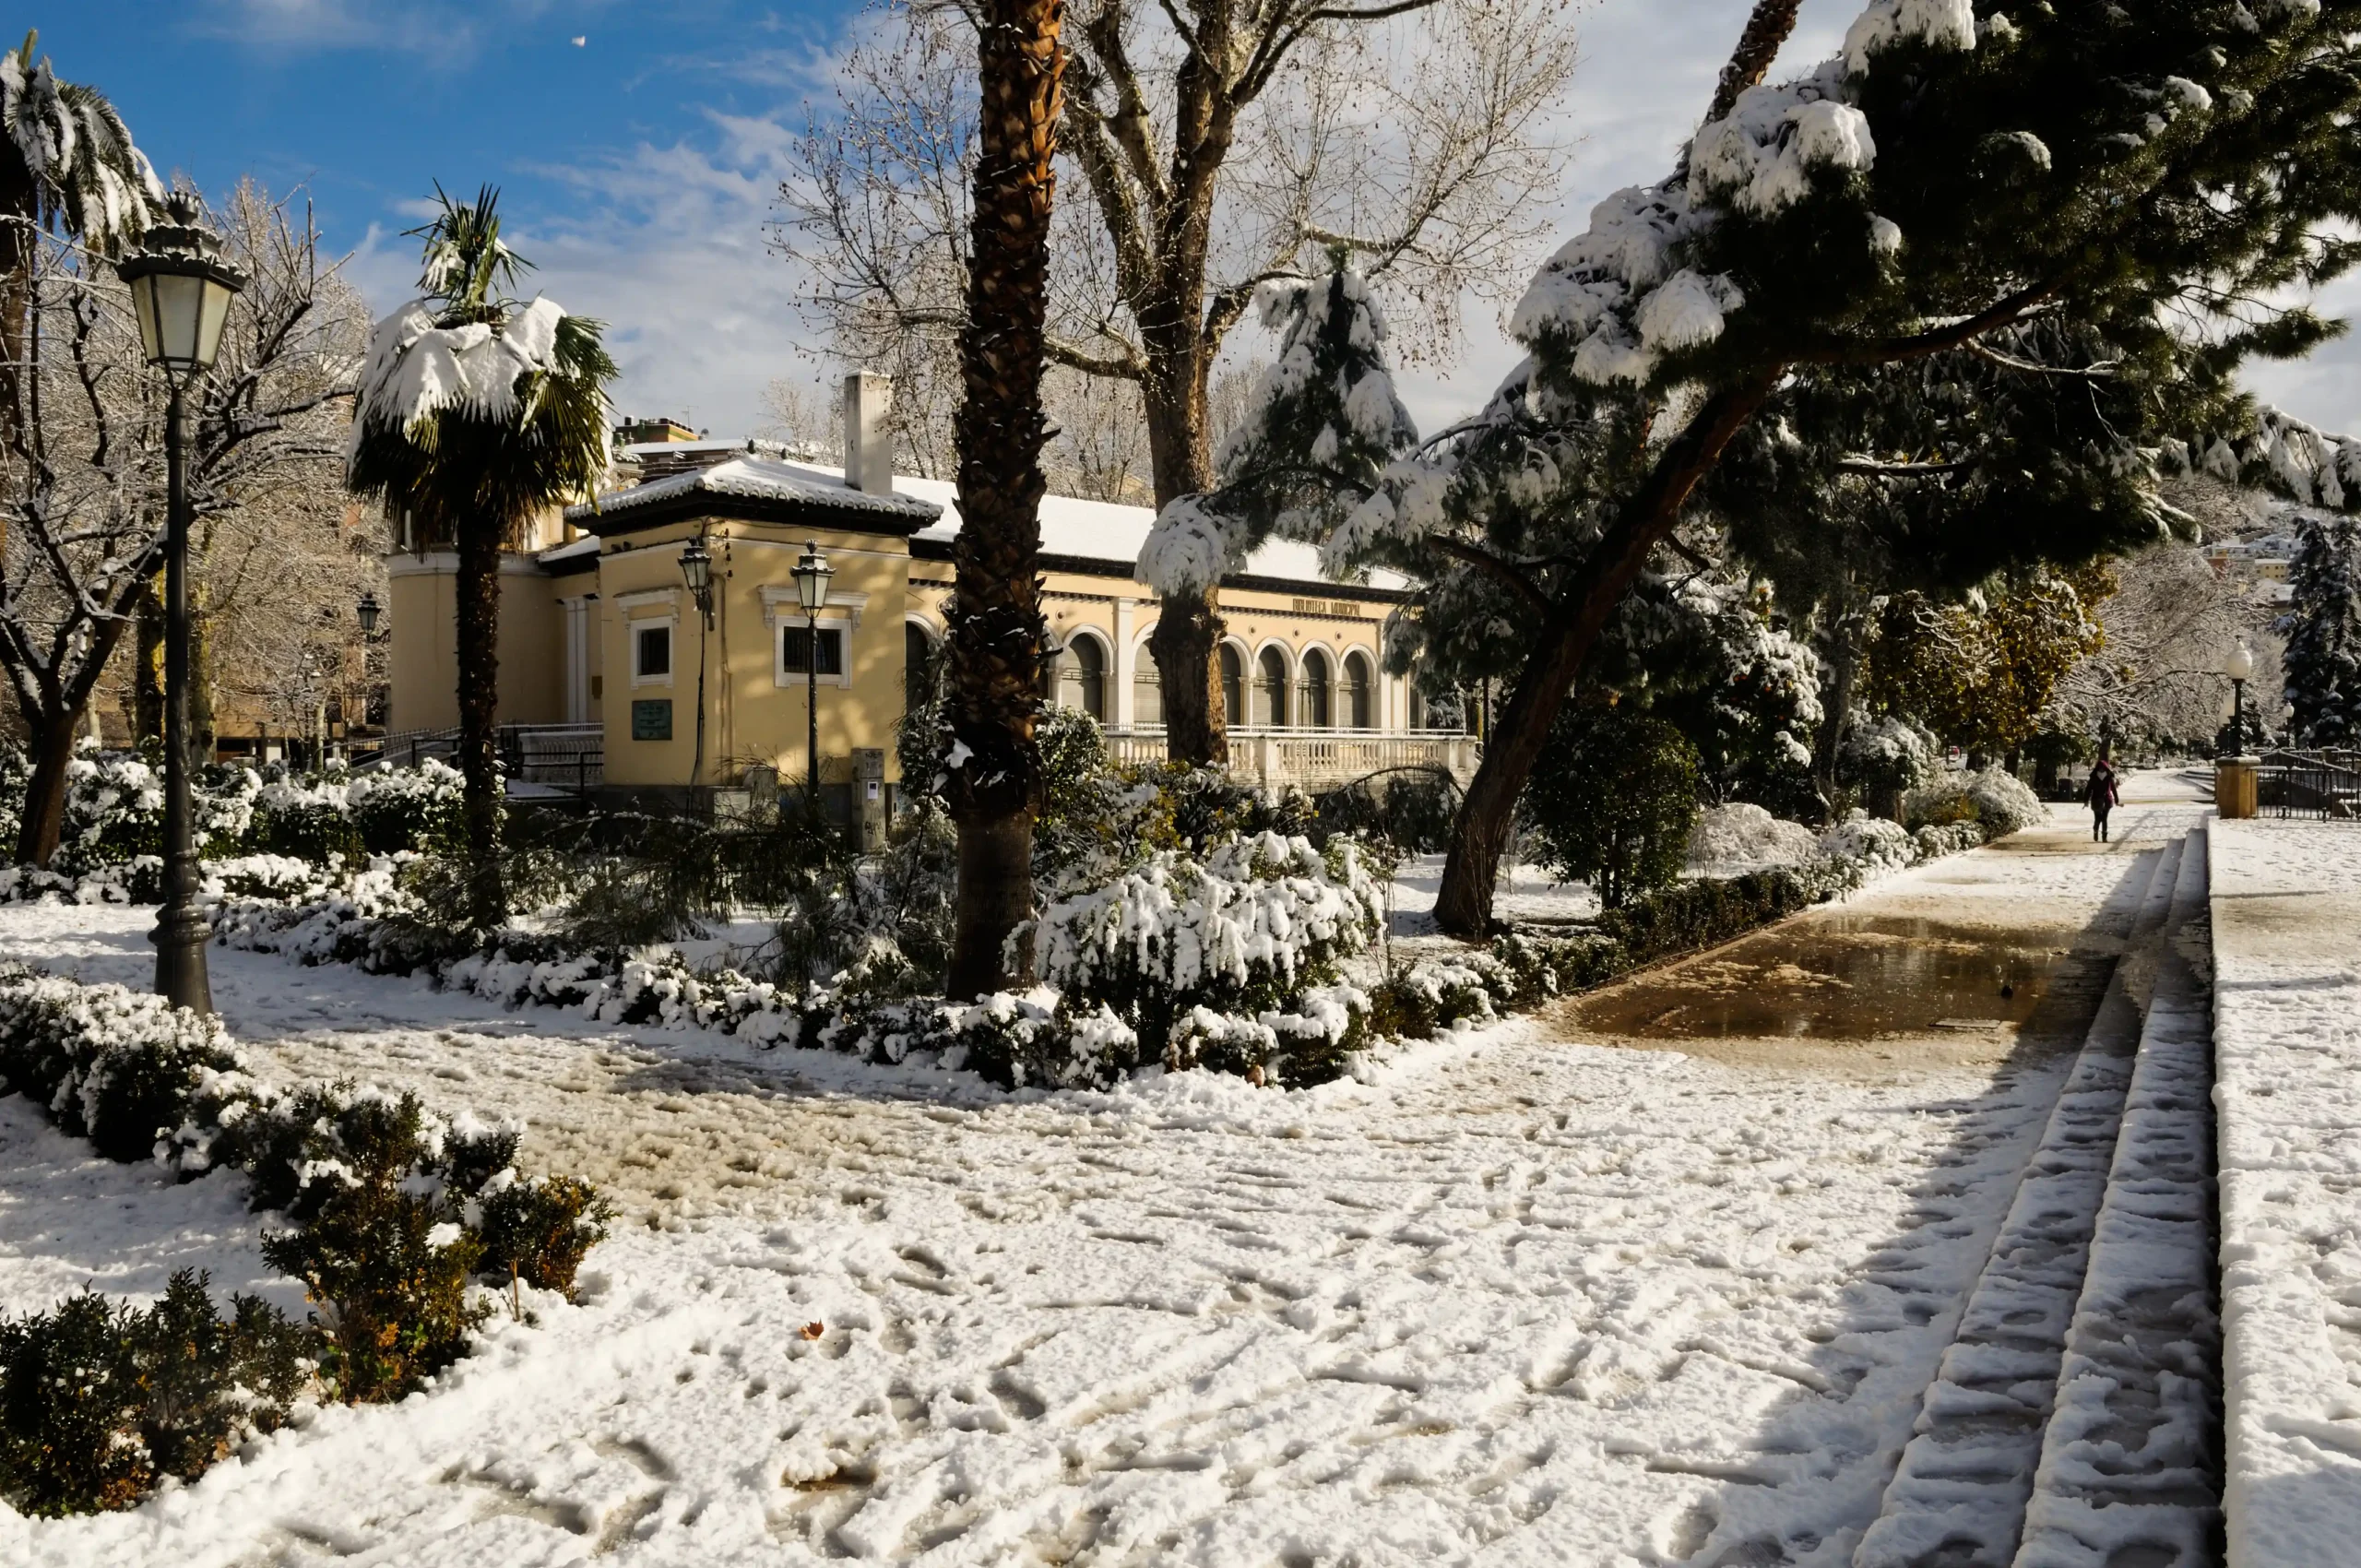
“The Soo,” as locals call it sits one inch behind Marquette in the annual average and occupies one of the most geographically interesting snowfall positions in the country. Sault Ste. Marie is where Lake Superior drains into Lake Huron through the St. Mary’s River, and that location puts it in the path of lake-effect precipitation from two different directions depending on wind patterns. Most lake-effect cities get hit by one lake. The Soo gets hit by the whole system.
At 116 inches annually, Sault Ste. Marie’s snowfall is as reliable as any city on this list. The season begins in earnest in October and can extend through April with minimal interruption. January and February bring the deepest cold alongside storm events that layer 12–15 inches in a single day, then repeat within the week. Blowing and drifting snow is a significant secondary hazard — even after a storm passes, sustained winds can reduce visibility to near zero and make roads impassable despite minimal fresh accumulation.
There’s also an international dimension here that no other city on this list has. Sault Ste. Marie, Ontario, sits directly across the river and the Canadian city records similarly staggering snowfall totals. Lake-effect doesn’t recognise national borders. Both communities operate on the shared understanding that winter will test them hard and reliably every year, without exception.
Snow season: October through April
Peak month: January–February
Closure risk: Very High
3. Syracuse, New York
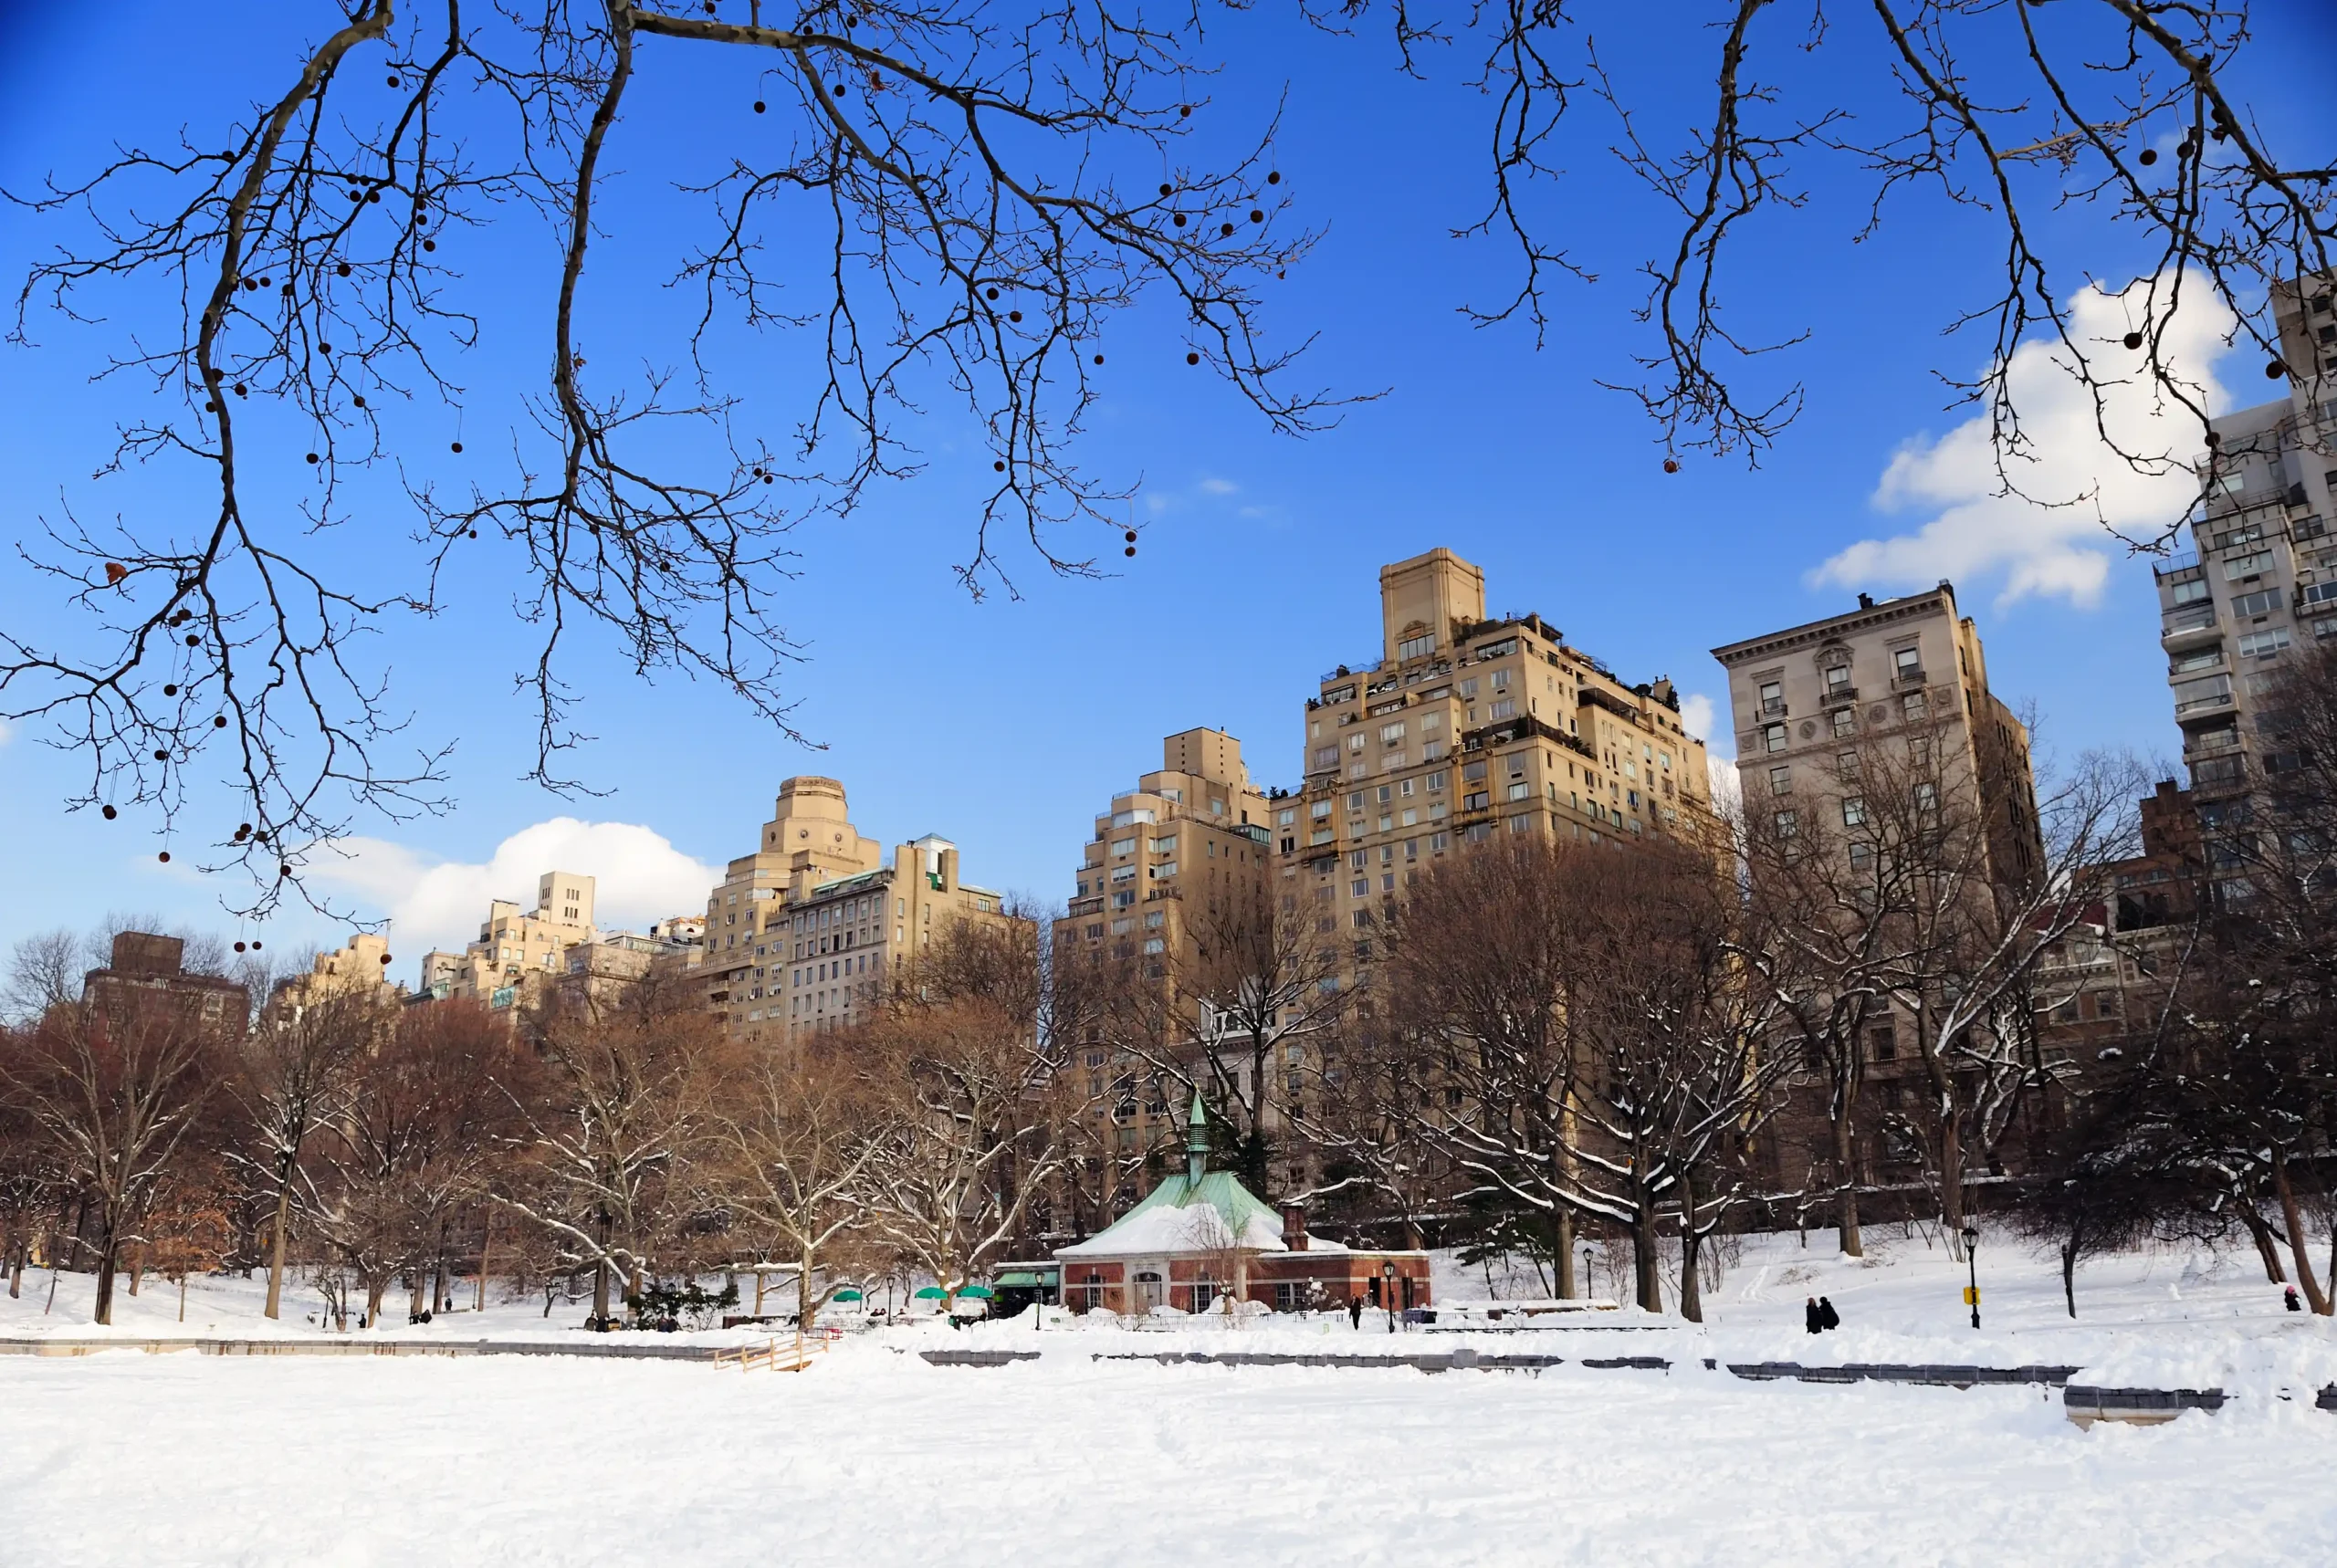
Syracuse is the snowiest city in the US for cities with a population over 100,000, and it’s held that title for decades. The mechanism is Lake Ontario, which acts like a snow cannon aimed directly at Central New York every time cold Canadian air sweeps down from the northwest. The lake runs nearly east-west, and the prevailing wind tracks moisture straight from the open water to Syracuse’s doorstep.
Lake-effect events in Syracuse are legendary. A single November or December system can unload 30–40 inches of snow in under 48 hours, burying cars and turning residential streets into channels between snow walls. The “Syracuse Snowbelt” extends south and east of the city into Madison and Cortland counties, where elevation amplifies lake-effect totals; in some rural areas around Syracuse, over 200 inches are seen in exceptional winters. The city itself is the more manageable end of that spectrum.
For parents and students in Onondaga County, snow days are not a novelty. They’re a line item in the school calendar. Most districts in the Syracuse area build multiple closure days into their academic schedule before the year begins, because the math of 114 annual inches makes it inevitable. The question school administrators deal with each winter isn’t whether closures will happen; it’s which particular storms to call.
Syracuse is the city most people cite when debating which city is the snowiest in the US, and while Marquette and Sault Ste. Marie technically outpaces it in raw inches; no American city of its size comes anywhere close to 114 inches per year. For large-city residents, Syracuse is the benchmark.
Snow season: November through April
Peak month: December–January
Closure risk: Very High
4. Erie, Pennsylvania
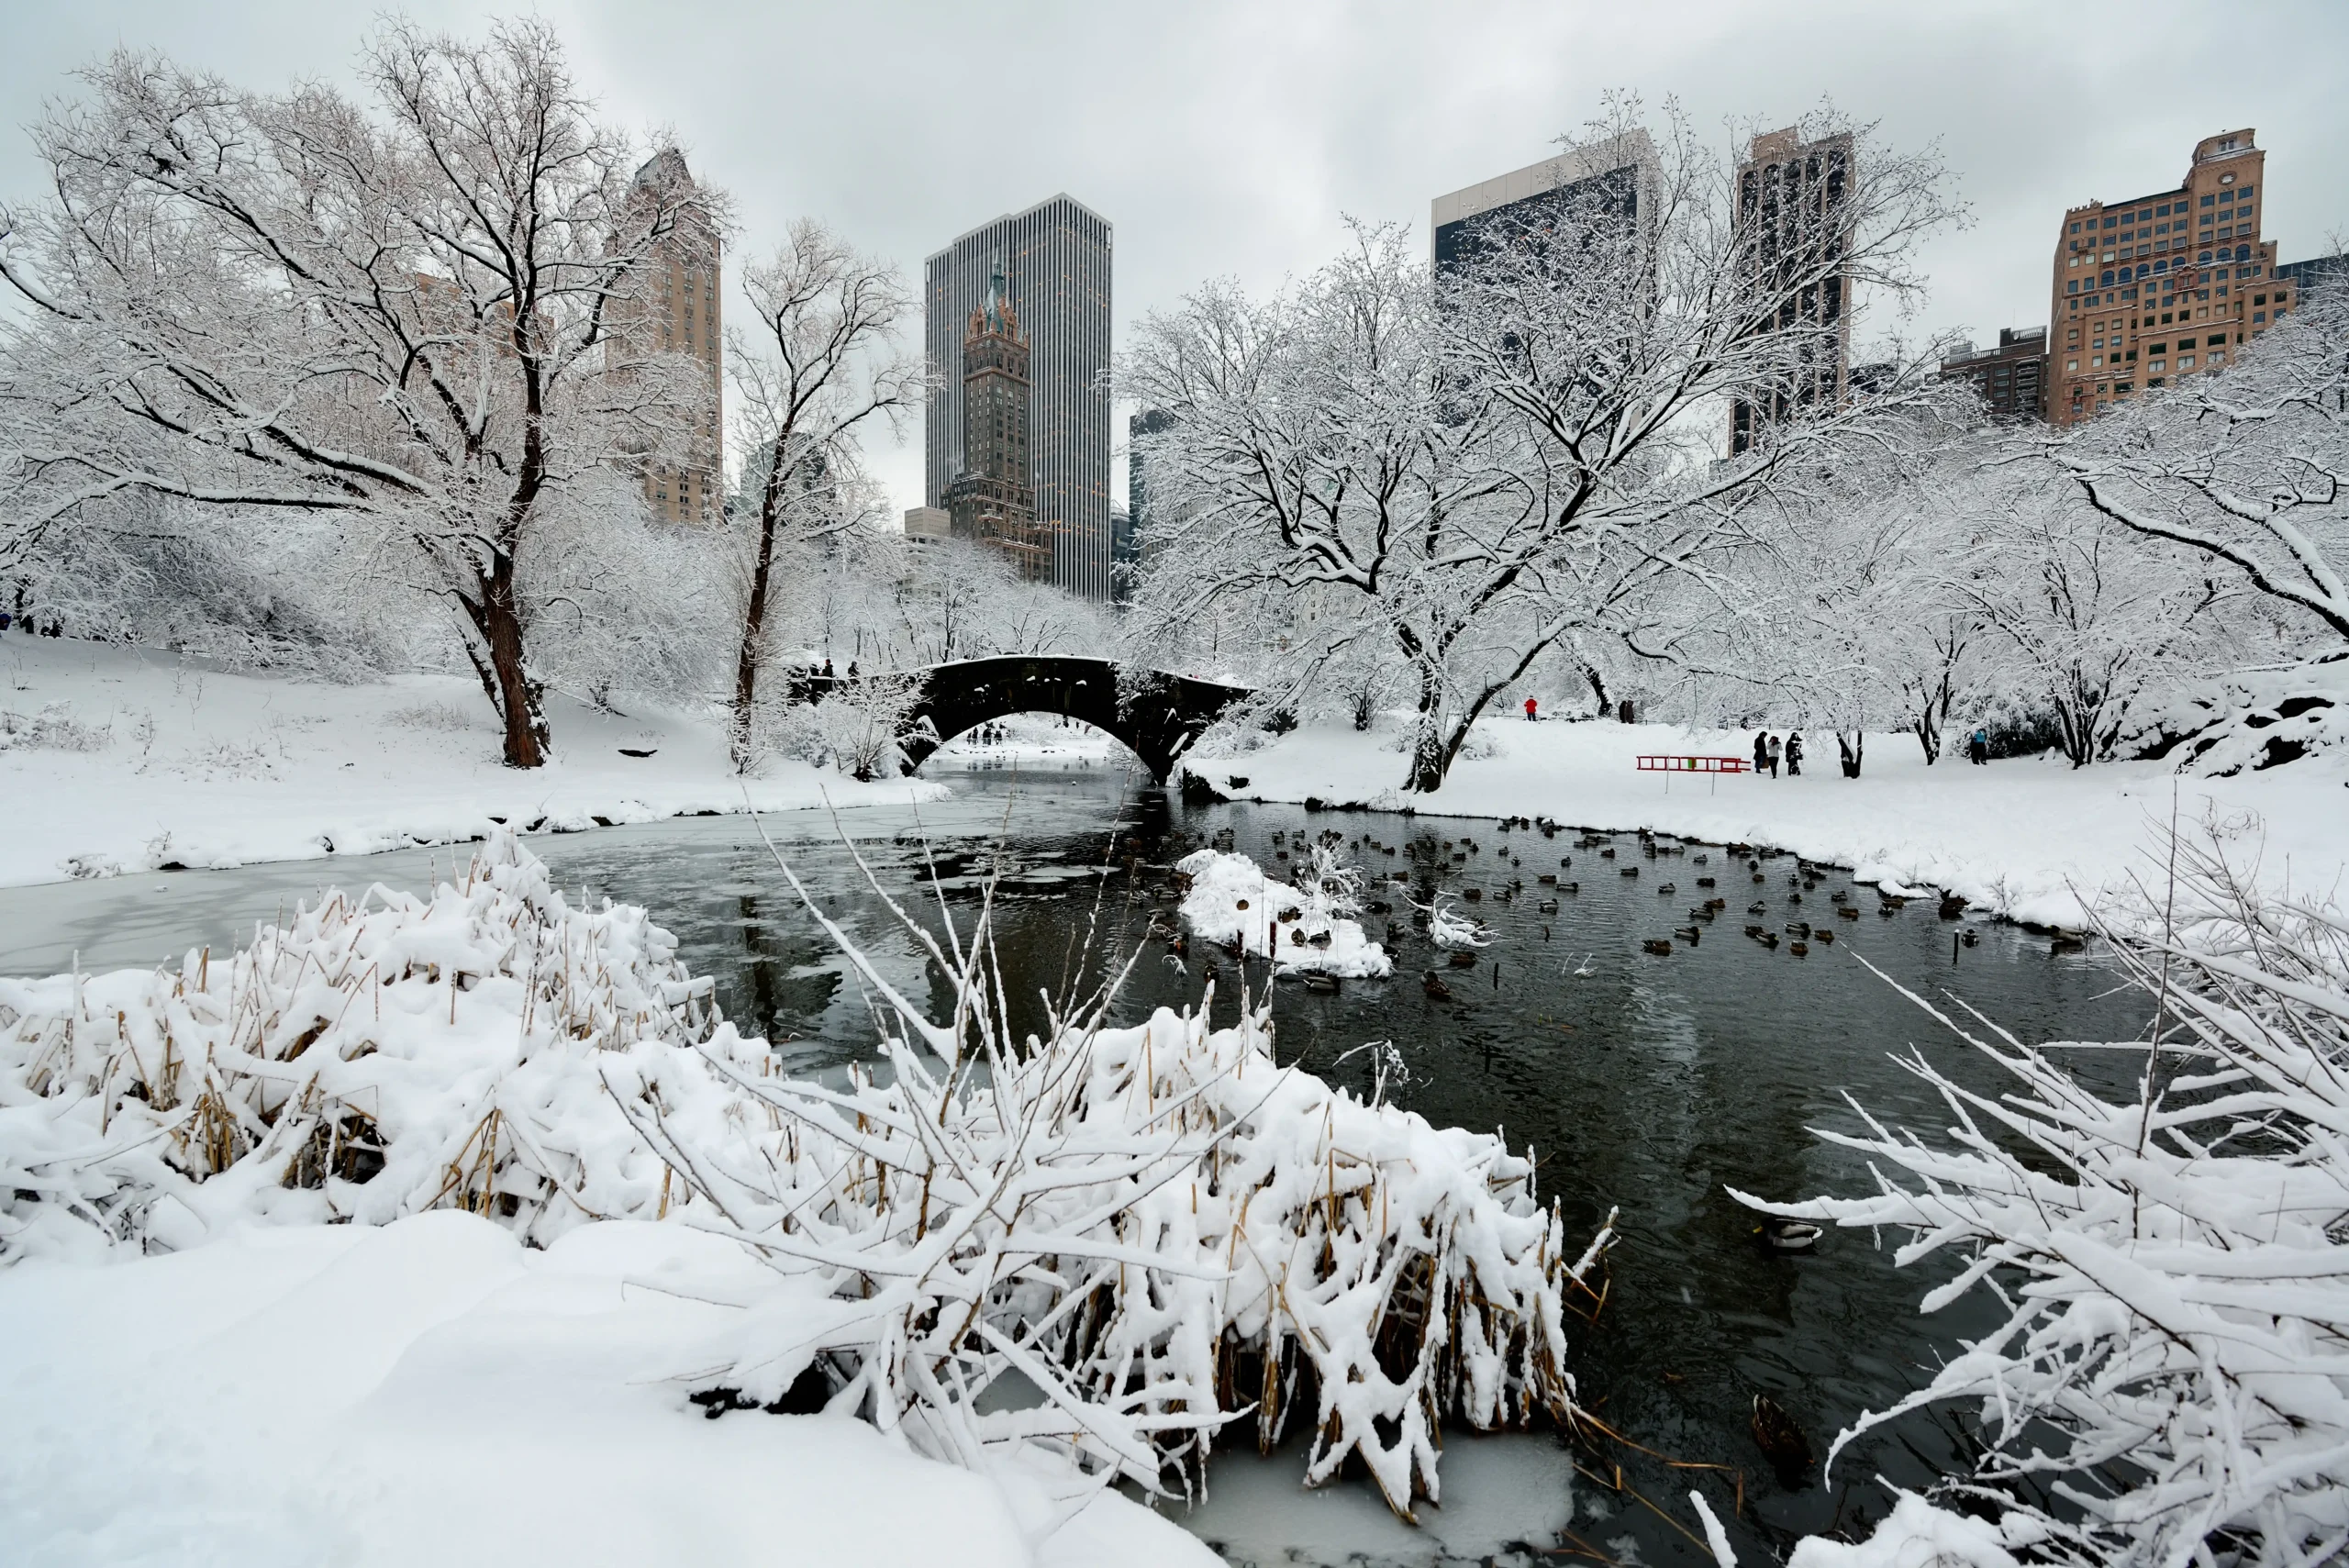
Erie gets hit by lake-effect snow from Lake Erie, specifically from a long east-west fetch that allows cold air to travel nearly the full length of the lake before hitting the Pennsylvania shoreline. That geography makes Erie one of the most reliable and intense lake-effect targets in the Great Lakes system, averaging 100 inches annually and tending toward sudden, heavy events rather than steady accumulation.
November is Erie’s most dangerous month. Lake Erie doesn’t fully freeze until late January in most years, which means the lake-effect machine is running at full capacity during November and December, the peak intensity months. A single November storm in Erie can produce totals that would be considered record-breaking events in most of the country. Thirty inches in 24 hours is not unheard of here. It happens with uncomfortable regularity.
Interstate 90, which follows the Lake Erie shoreline through Erie County, is one of the most frequently closed highway sections in the Northeast during lake-effect setups. The problem isn’t always the total accumulation, it’s the rate of snowfall and the wind-driven visibility conditions that make driving genuinely impossible before plows can respond. Closures on I-90 can extend for hours during active lake-effect bands.
If you’re in Erie and a lake-effect warning is posted for Lake Erie, check your snow day probability multiple times through the evening. These setups can intensify dramatically overnight as wind direction locks in and the band stalls over the city.
Snow season: November through April
Peak month: November–December
Closure risk: Very High
5. Flagstaff, Arizona
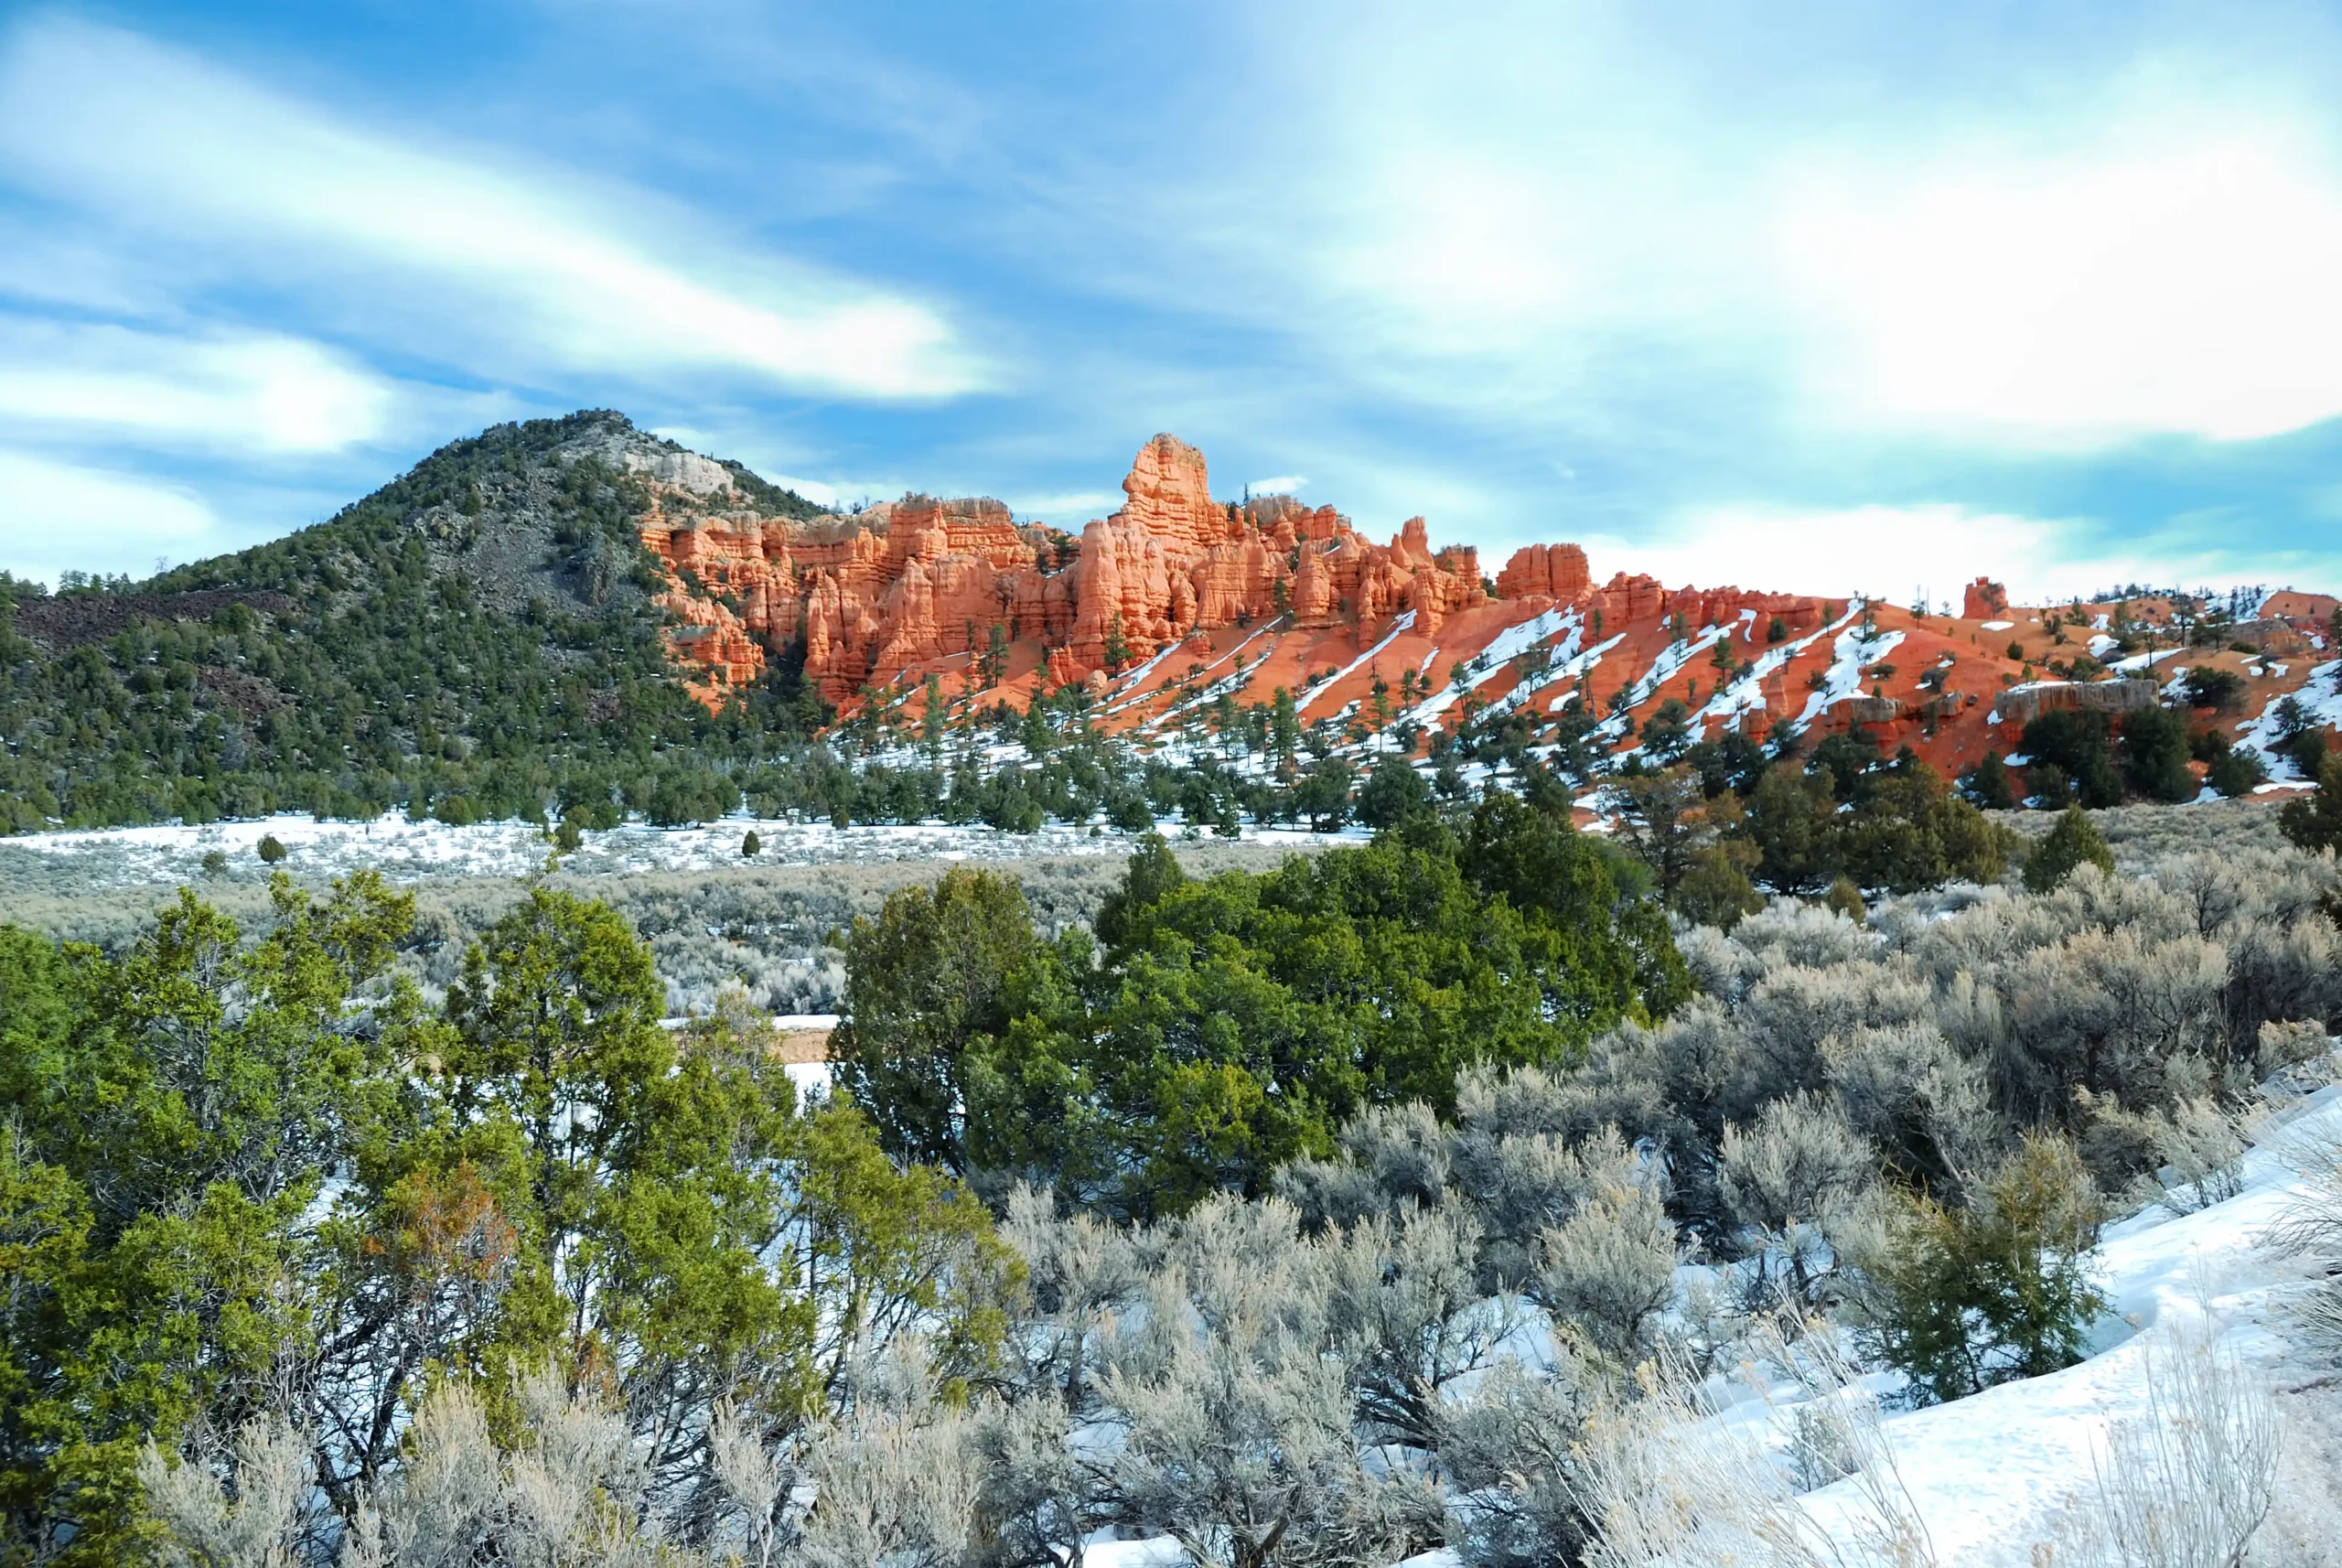
Of all the surprises on this list, Flagstaff is the biggest one. An Arizona city averaging 100 inches of snow per year, matching Erie, Pennsylvania and beating Buffalo by 6 inches. It’s the kind of data point that makes people check the source twice.
The explanation is elevation. Flagstaff sits at 6,910 feet on the Colorado Plateau, surrounded by the San Francisco Peaks, the highest range in Arizona, with the tallest summit just over 12,600 feet. At that altitude, Pacific moisture systems that barely register in Phoenix produce heavy, sustained snowfall in Flagstaff. The city is cold enough to preserve snow for days at a time, and its winter season runs from November through March with consistent accumulation that feels entirely unlike the rest of Arizona.
Flagstaff’s snowfall doesn’t come from lake-effect processes. It comes from Pacific storm tracks moving across the Southwest in winter, the same systems that produce heavy snow in the Sierra Nevada and the Rockies. As those storms move east and encounter the Colorado Plateau’s elevation, they’re forced to release moisture that lower-elevation Arizona would receive as rain, if it received anything at all.
The contrast with Phoenix is genuinely difficult to process. Phoenix, 150 miles south, averages less than half an inch of snow per year. Flagstaff gets 100 inches. Two cities, same state, separated by 5,000 feet of elevation. Flagstaff is unquestionably the snowiest city in the US west of the Mississippi River, and most people have no idea.
Snow season: November through March
Peak month: January–February
Closure risk: High
6. Rochester, New York
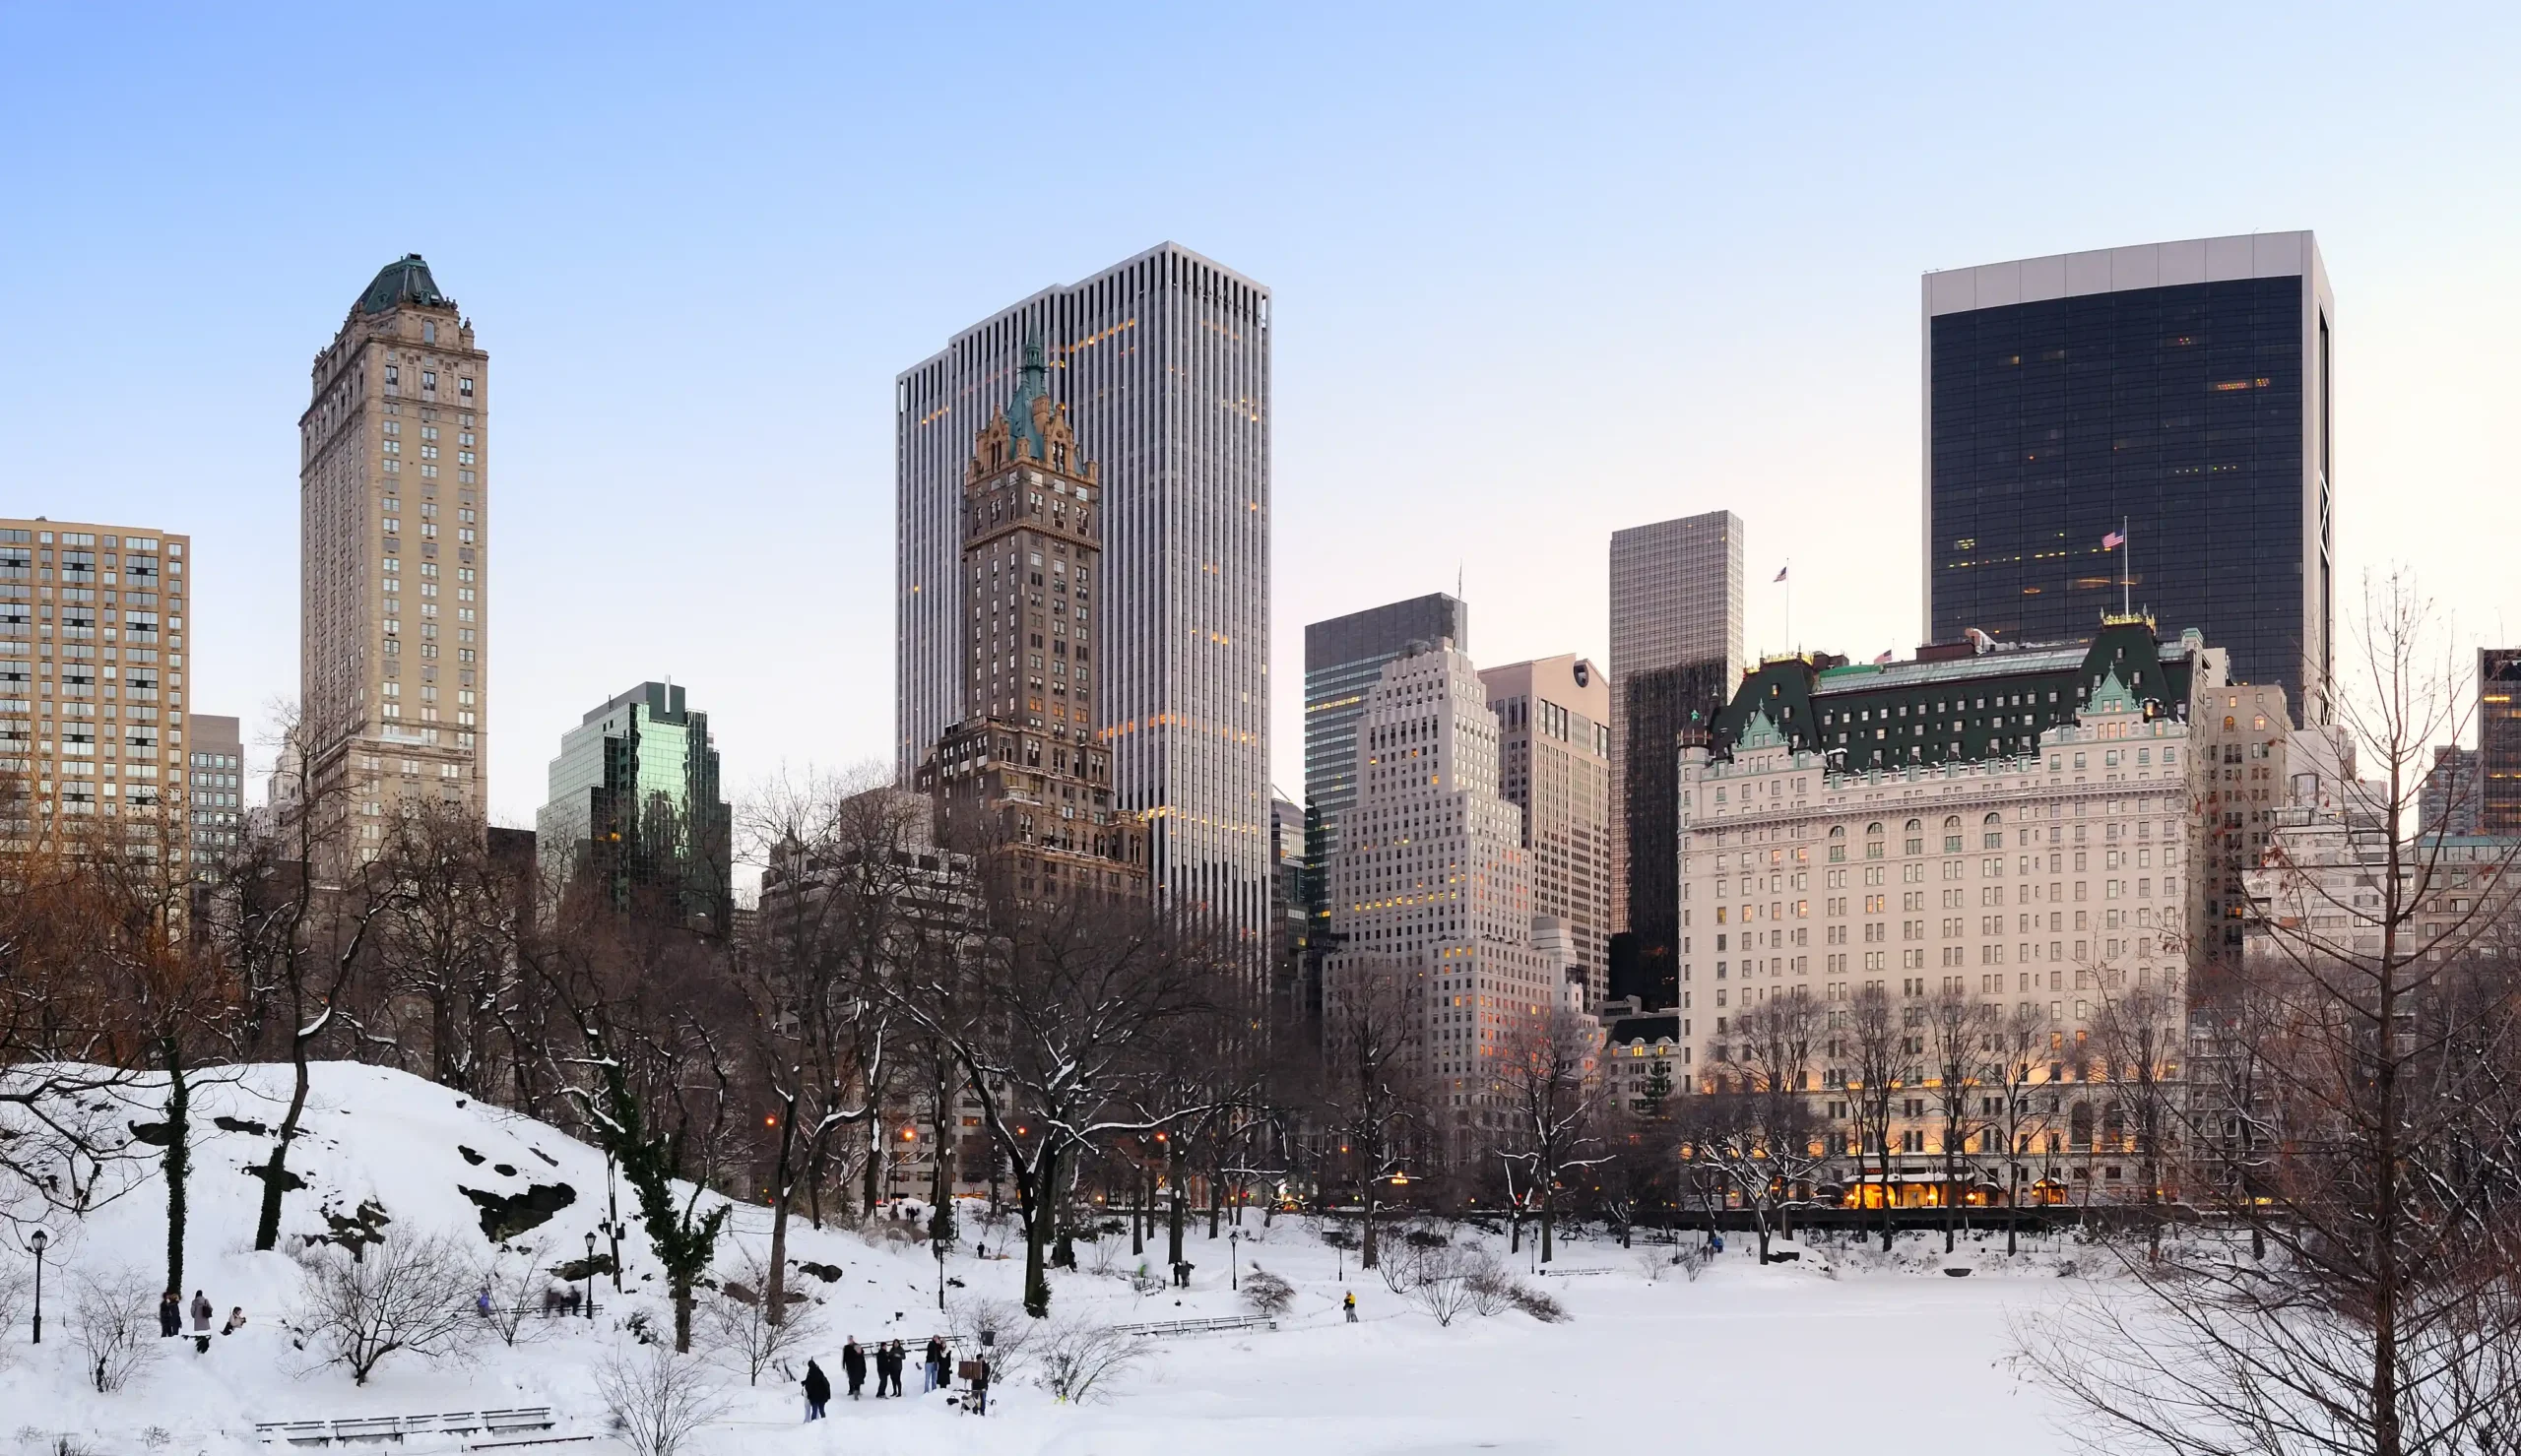
Rochester sits at the western end of Lake Ontario and averages 99 inches annually just behind Erie and Flagstaff, but solidly in the conversation for the snowiest city in US discussions that focus on large, accessible cities. Like Syracuse to the east, Rochester catches lake-effect snow from Ontario. But its positioning gives it a slightly different storm profile: more frequent moderate events rather than the extreme single-storm totals that define the Syracuse snowbelt.
The consistency is what stands out about Rochester. This isn’t a city that gets buried by two or three legendary storms and coasts to its annual total. Rochester accumulates steadily through November, December, January, and February, with 25 to 30 separate snowfall events per season, each adding a layer to what becomes a formidable cumulative total. In some winters that layer cake gets very deep very fast.
Monroe County school districts deal with closures regularly, though the gradual accumulation pattern means road crews often keep pace with individual events until a lake-effect band parks directly overhead, at which point the math changes. Rochester has experienced events where specific ZIP codes received 36 inches of snow while neighboring areas less than 10 miles away stayed completely dry. That’s what a stalled lake-effect band does.
The western New York snowbelt, anchored by Rochester and Buffalo, is one of the most intensely studied lake-effect regions in the world, with NOAA and the NWS maintaining extensive monitoring networks specifically because the snowfall patterns are so reliable and so extreme.
Snow season: November through April
Peak month: January
Closure risk: High
7. Buffalo, New York
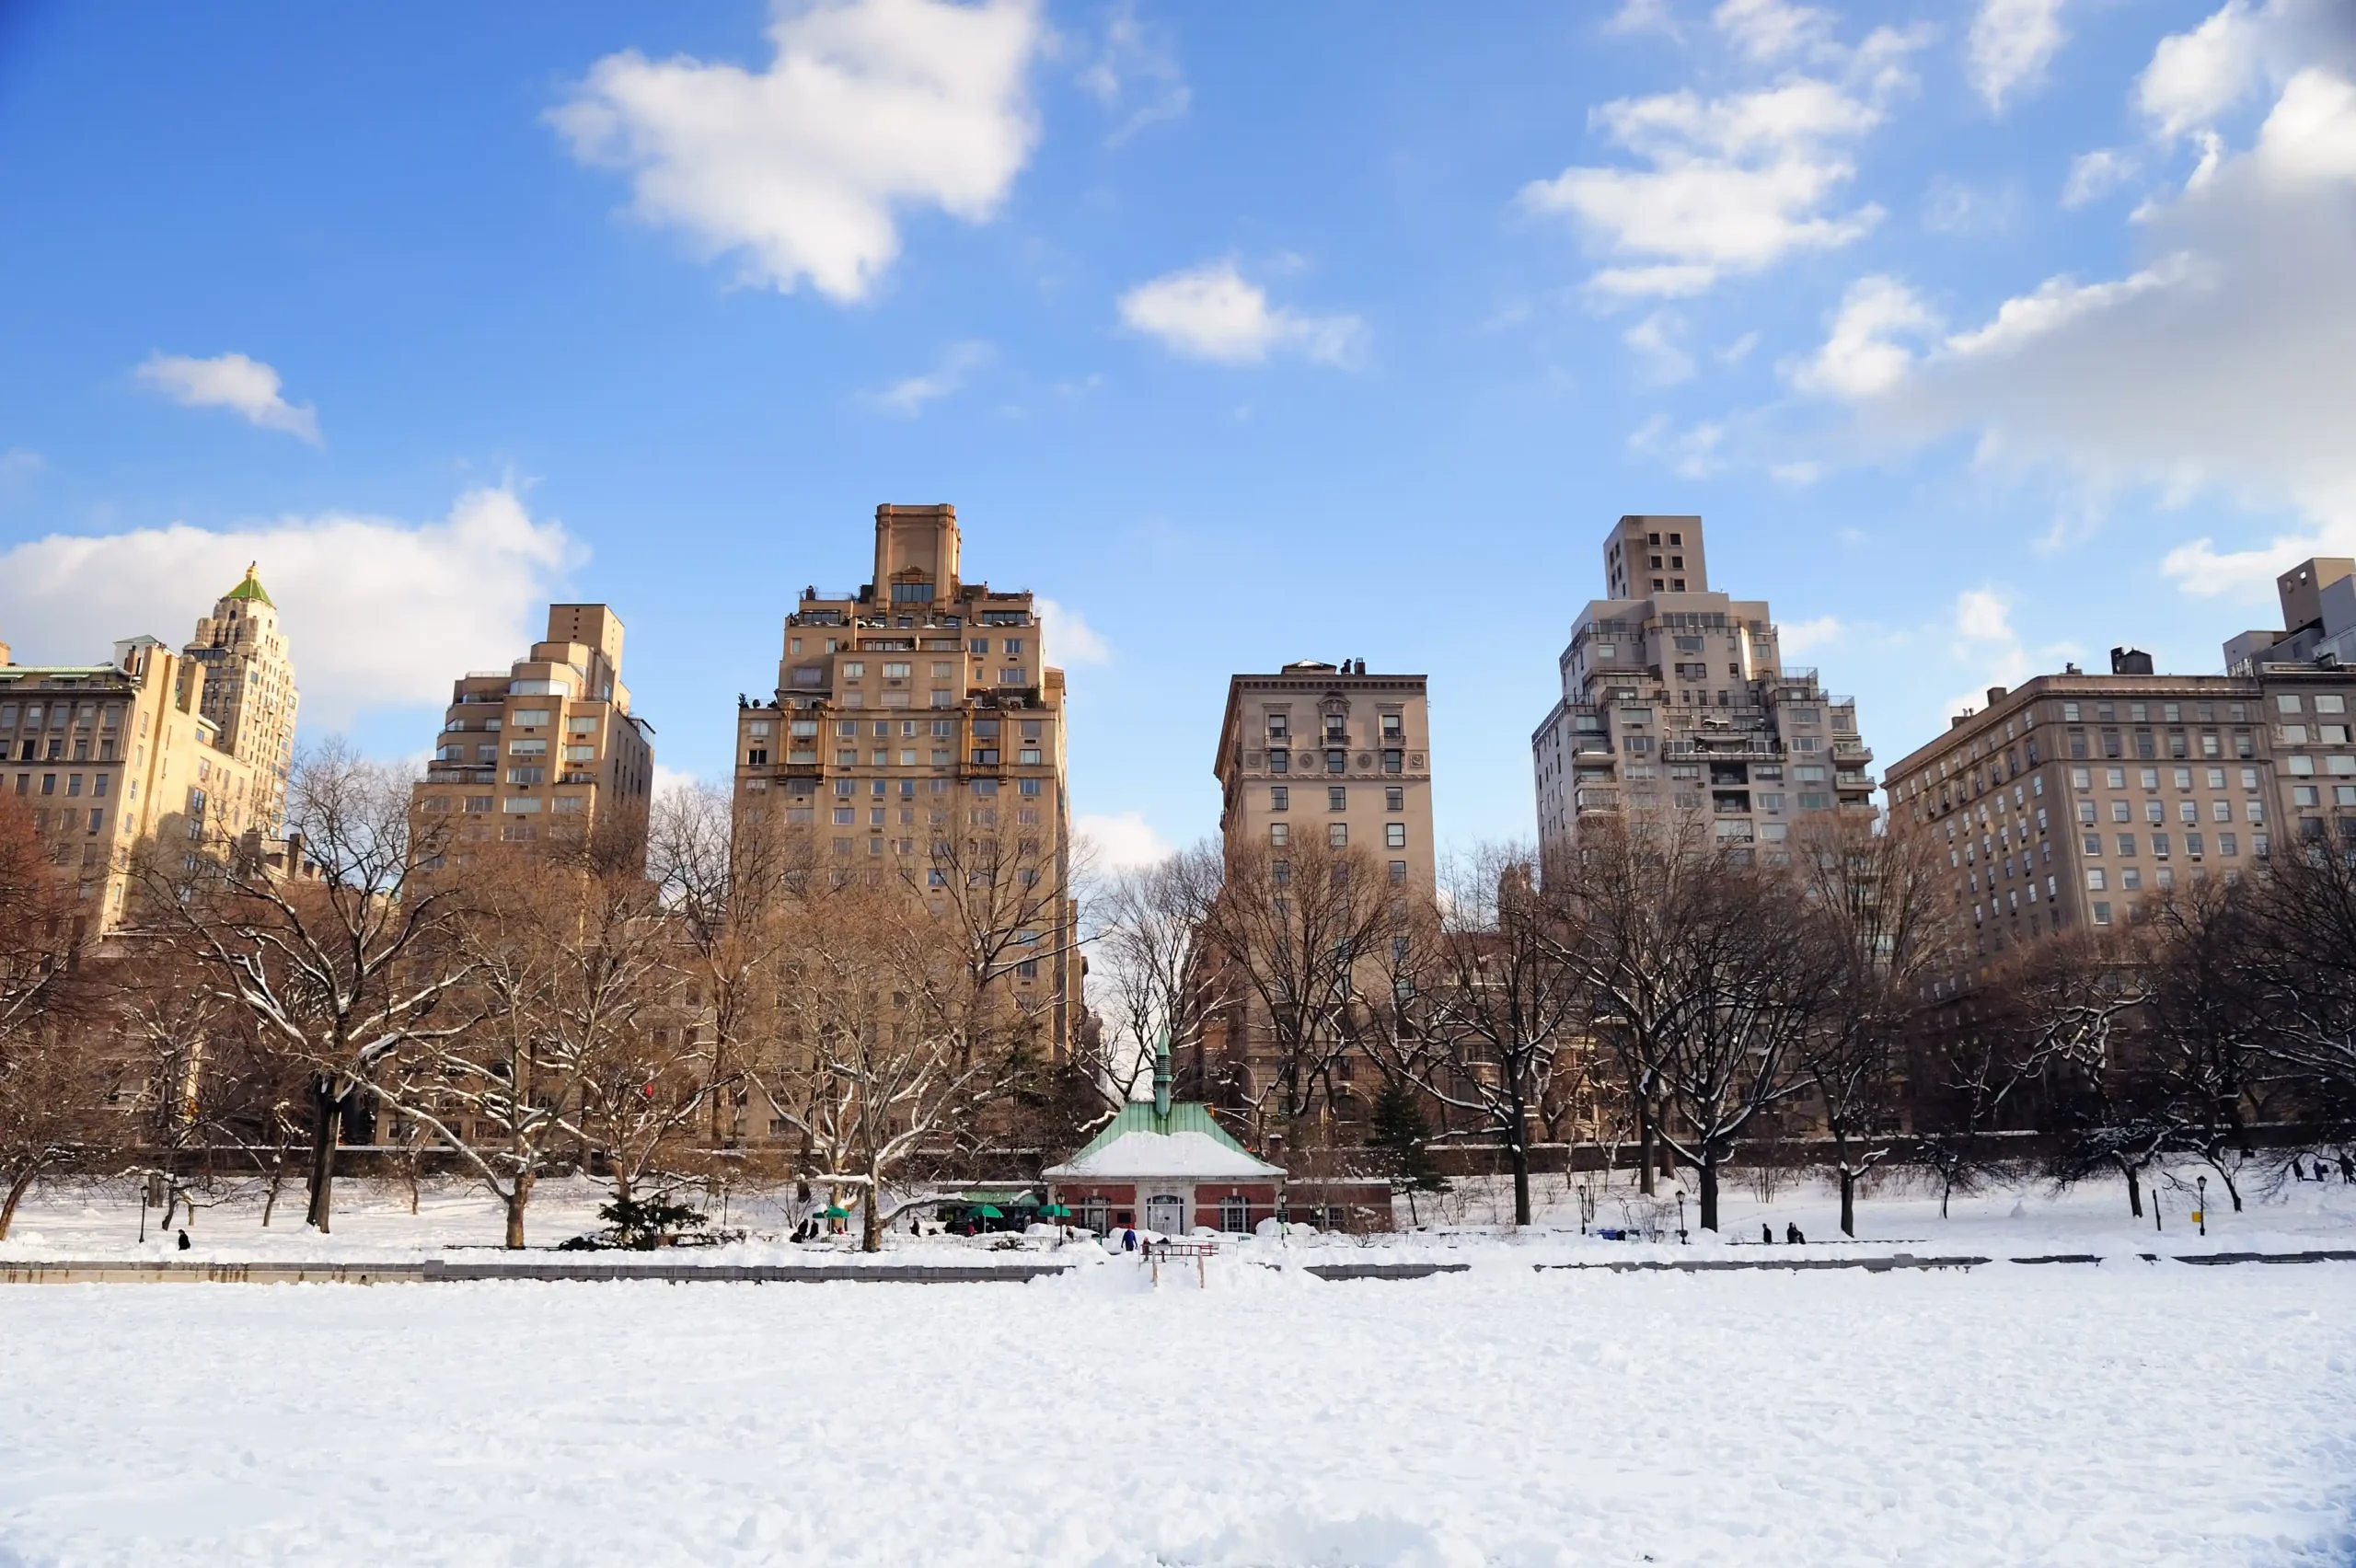
Buffalo’s annual average of 94 inches tells only part of its story. Of all the cities on this list, Buffalo has the most dramatic gap between its average and its worst-case events. The “Blizzard of ’77.” The November 2014 lake-effect event that buried the Southtowns under 60–70 inches in three days. The December 2022 blizzard that killed dozens, shut down the city for a week, and produced conditions that even experienced Buffalo residents described as unlike anything they’d seen before.
Lake Erie drives Buffalo’s snowfall, and the Southtowns, Lancaster, Cheektowaga, Orchard Park, areas southeast and east of the city center are disproportionately affected because of their elevation and position relative to the typical lake-effect band trajectory. City-level totals and Southtown totals in a major event can differ by 40 or 50 inches. They’re in the same metropolitan area. The storm is the same. The experience is completely different.
Buffalo’s school closure decisions are among the most watched in the country during major lake-effect setups. The Erie County Emergency Services office and the NWS Buffalo forecast office maintain active public communication during significant events, issuing travel bans that carry legal force during the most severe storms.
Despite everything, Buffalo doesn’t want your sympathy. Residents wear the city’s winter reputation as a point of civic pride, and the emergency management infrastructure here is genuinely built for exactly this level of snowfall in a way that most cities are not.
Snow season: November through March
Peak month: December–January
Closure risk: High
8. Duluth, Minnesota
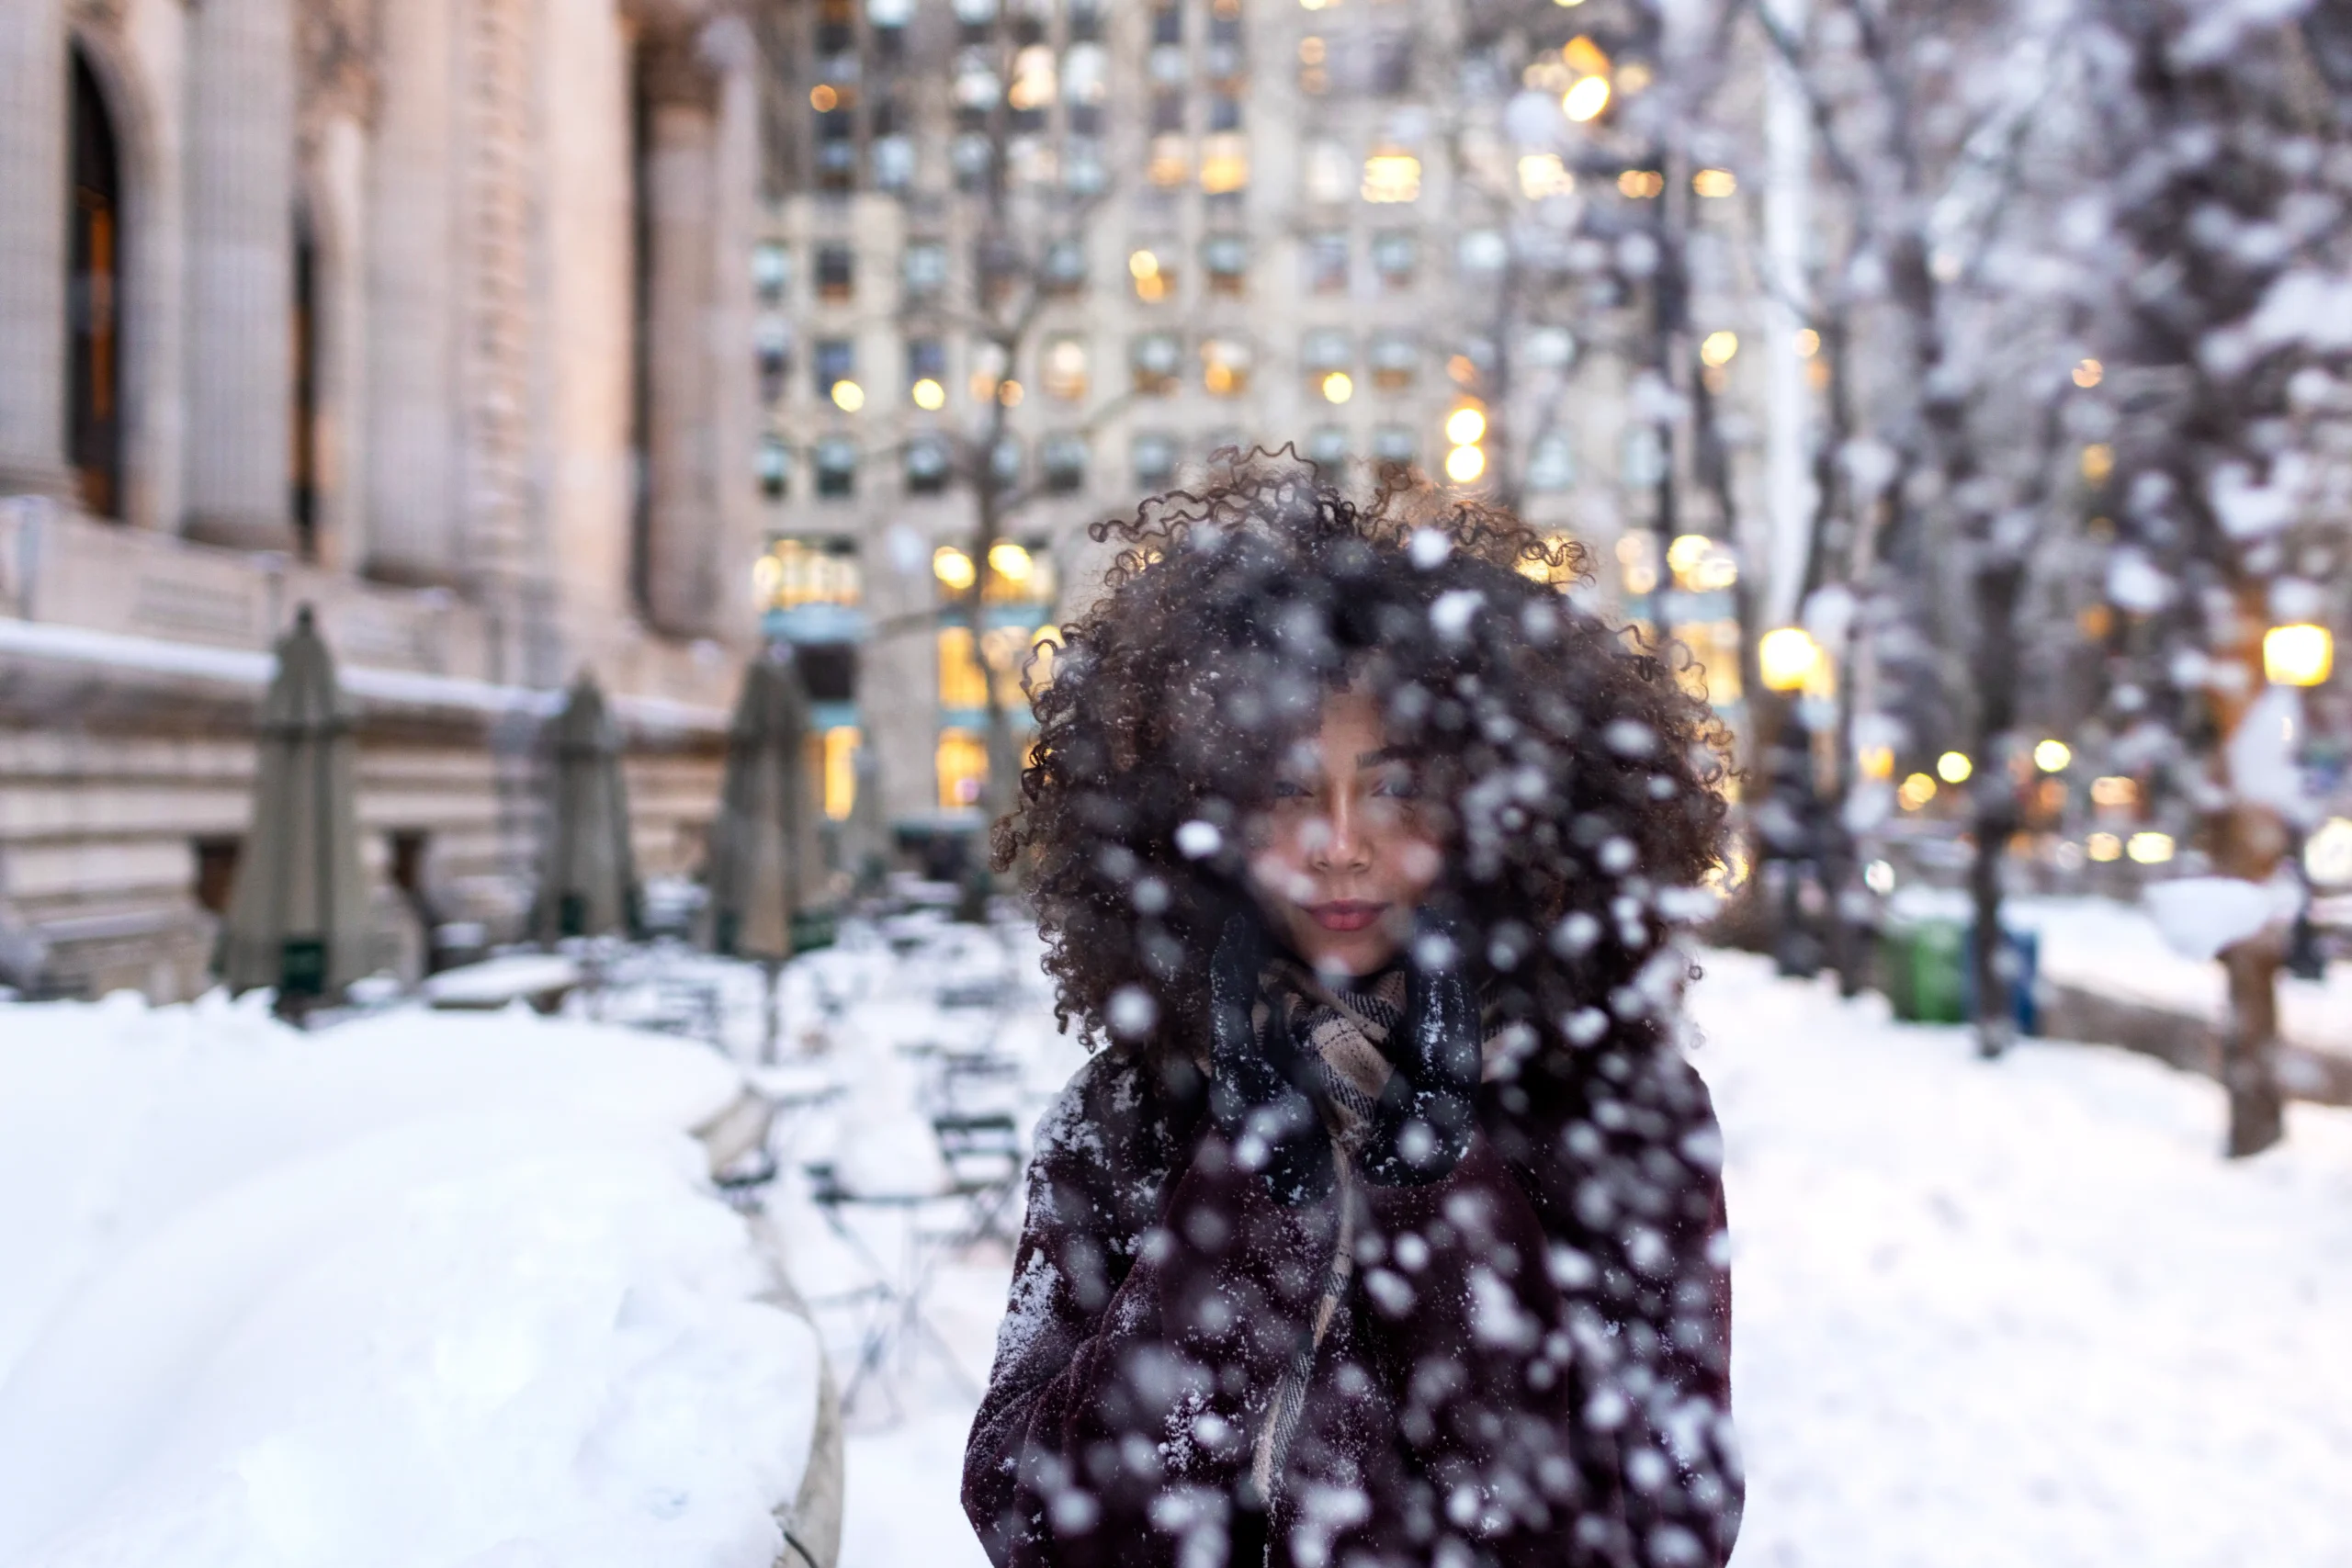
Duluth sits at the western tip of Lake Superior, sharing a lake with Marquette and Sault Ste. Marie, though its snowfall total of 86 inches is lower than its Upper Peninsula counterparts. The difference is position: Duluth is at the western end of the lake where the fetch — the distance cold air travels over open water before reaching shore is shorter, producing less intense lake-effect than the cities on Superior’s southern shore.
What Duluth has instead is duration. The city averages over 100 days of measurable snowfall per year. That’s not occasional winter weather. That’s one in every three days of the entire calendar year with snow falling somewhere in the city. Combined with Duluth’s northern latitude, roughly equivalent to Montreal’s, and its position on a hillside rising steeply from the lakeshore, this creates a city that is genuinely one of the most winter-intensive major communities in the continental US.
The hillside geography is worth understanding. Duluth is built on a slope, with neighbourhoods at vastly different elevations connected by steep streets. A storm that leaves the waterfront passable can leave upper-hillside neighbourhoods completely inaccessible. School districts here have to think about terrain, not just accumulation totals, when making closure calls.
Duluth is also known for lake-effect thundersnow, lightning, and thunder during heavy snowfall events, which indicate the most intense atmospheric instability in the lake-effect band. If you’re watching a storm approach Duluth and the thunder starts, the snowfall rate is about to become extraordinary.
Snow season: October through April
Peak month: January–February
Closure risk: High
9. Anchorage, Alaska
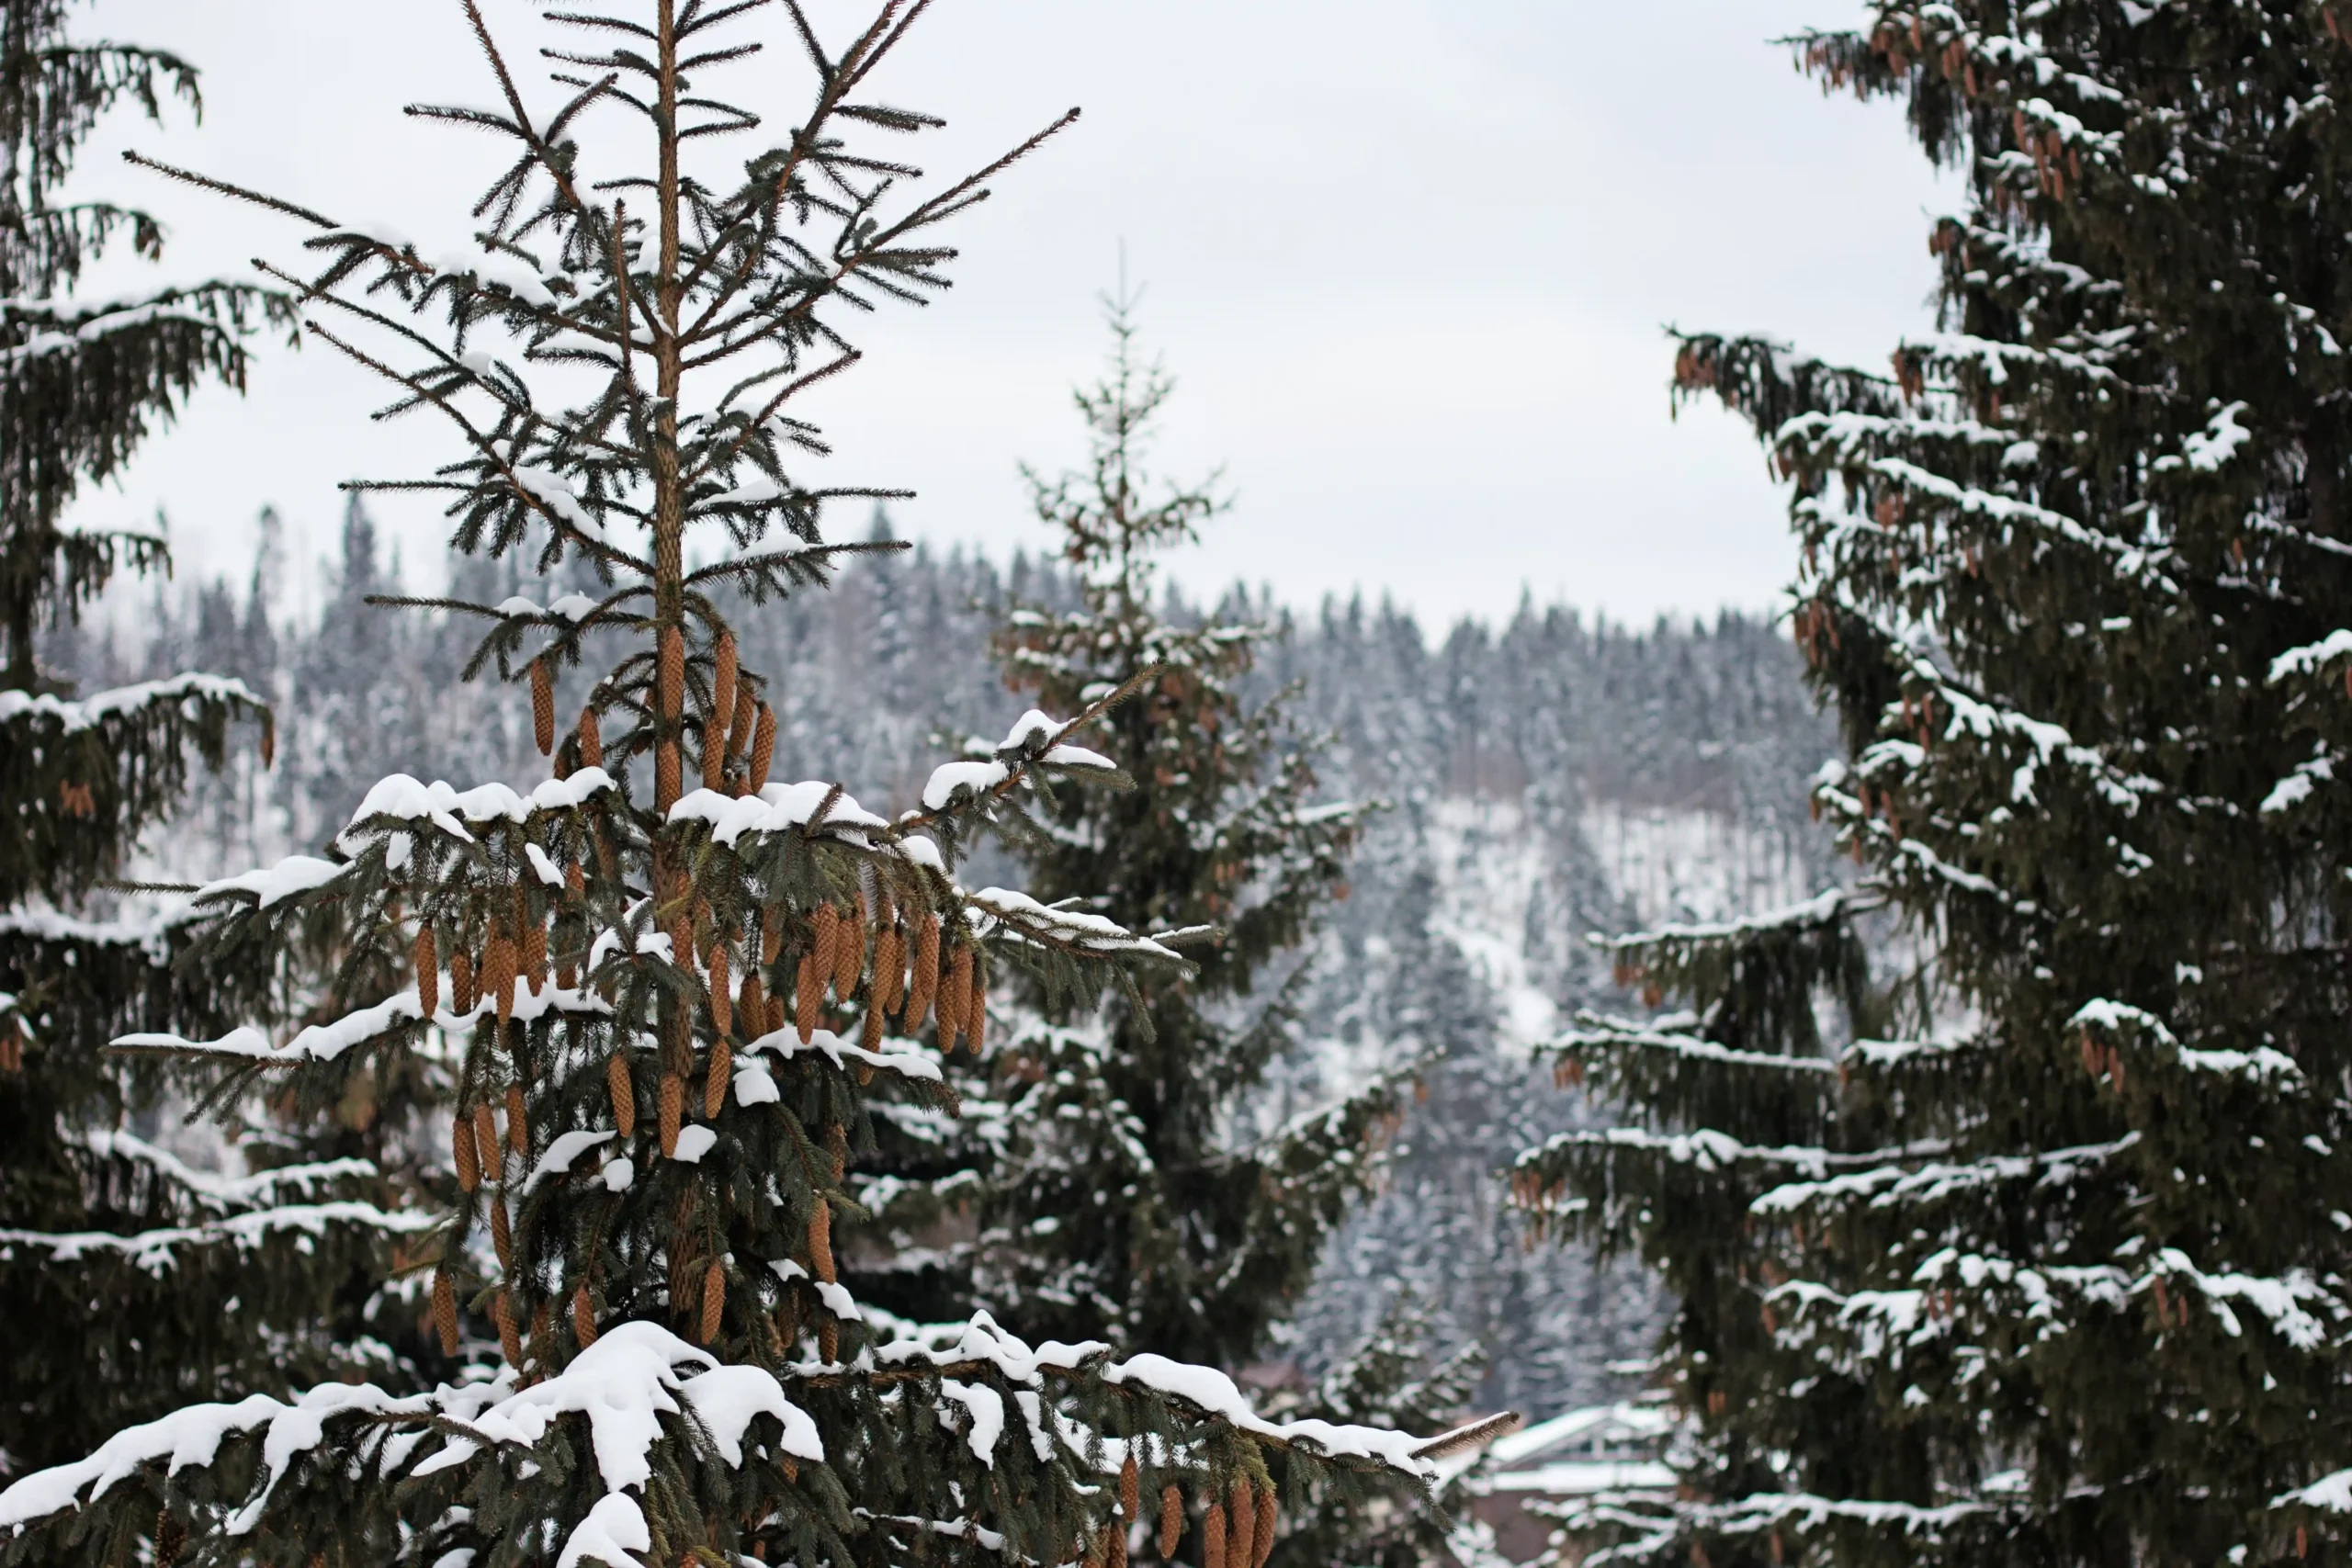
Anchorage is the only city on this list outside the continental United States, and its inclusion requires a note: if you asked specifically what is the snowiest city in the continental US, Anchorage doesn’t qualify. It’s in Alaska. But it averages 75 inches of annual snowfall, it’s among the most frequently searched US cities for snowfall data, and leaving it out of the broader US conversation would be a genuine omission.
What’s striking about Anchorage isn’t just the total; it’s the operating conditions. The city sits between the Chugach Mountains and Cook Inlet, creating a unique microclimate where mountain-enhanced snowfall on the eastern neighbourhoods contrasts with slightly milder conditions near the water. Some Anchorage neighbourhoods receive dramatically more snow than others based purely on their position relative to the terrain.
Winter darkness amplifies everything. By December, Anchorage sees fewer than 6 hours of daylight. That means navigating heavy snow and ice in conditions that are, for much of the day, essentially nocturnal. Temperatures dropping to -20°F are not unusual. The combination of snow totals, darkness, and extreme cold creates a winter experience that is qualitatively different from anything the lower 48 cities on this list face.
School closures in Anchorage are relatively rare despite the totals; the city is simply built for winter in ways that make most events manageable. Only extreme cold, sustained high winds, or ice storms typically push closures. That’s what 75 inches a year teaches you.
Snow season: October through May
Peak month: January
Closure risk: Moderate-High
10. Worcester, Massachusetts
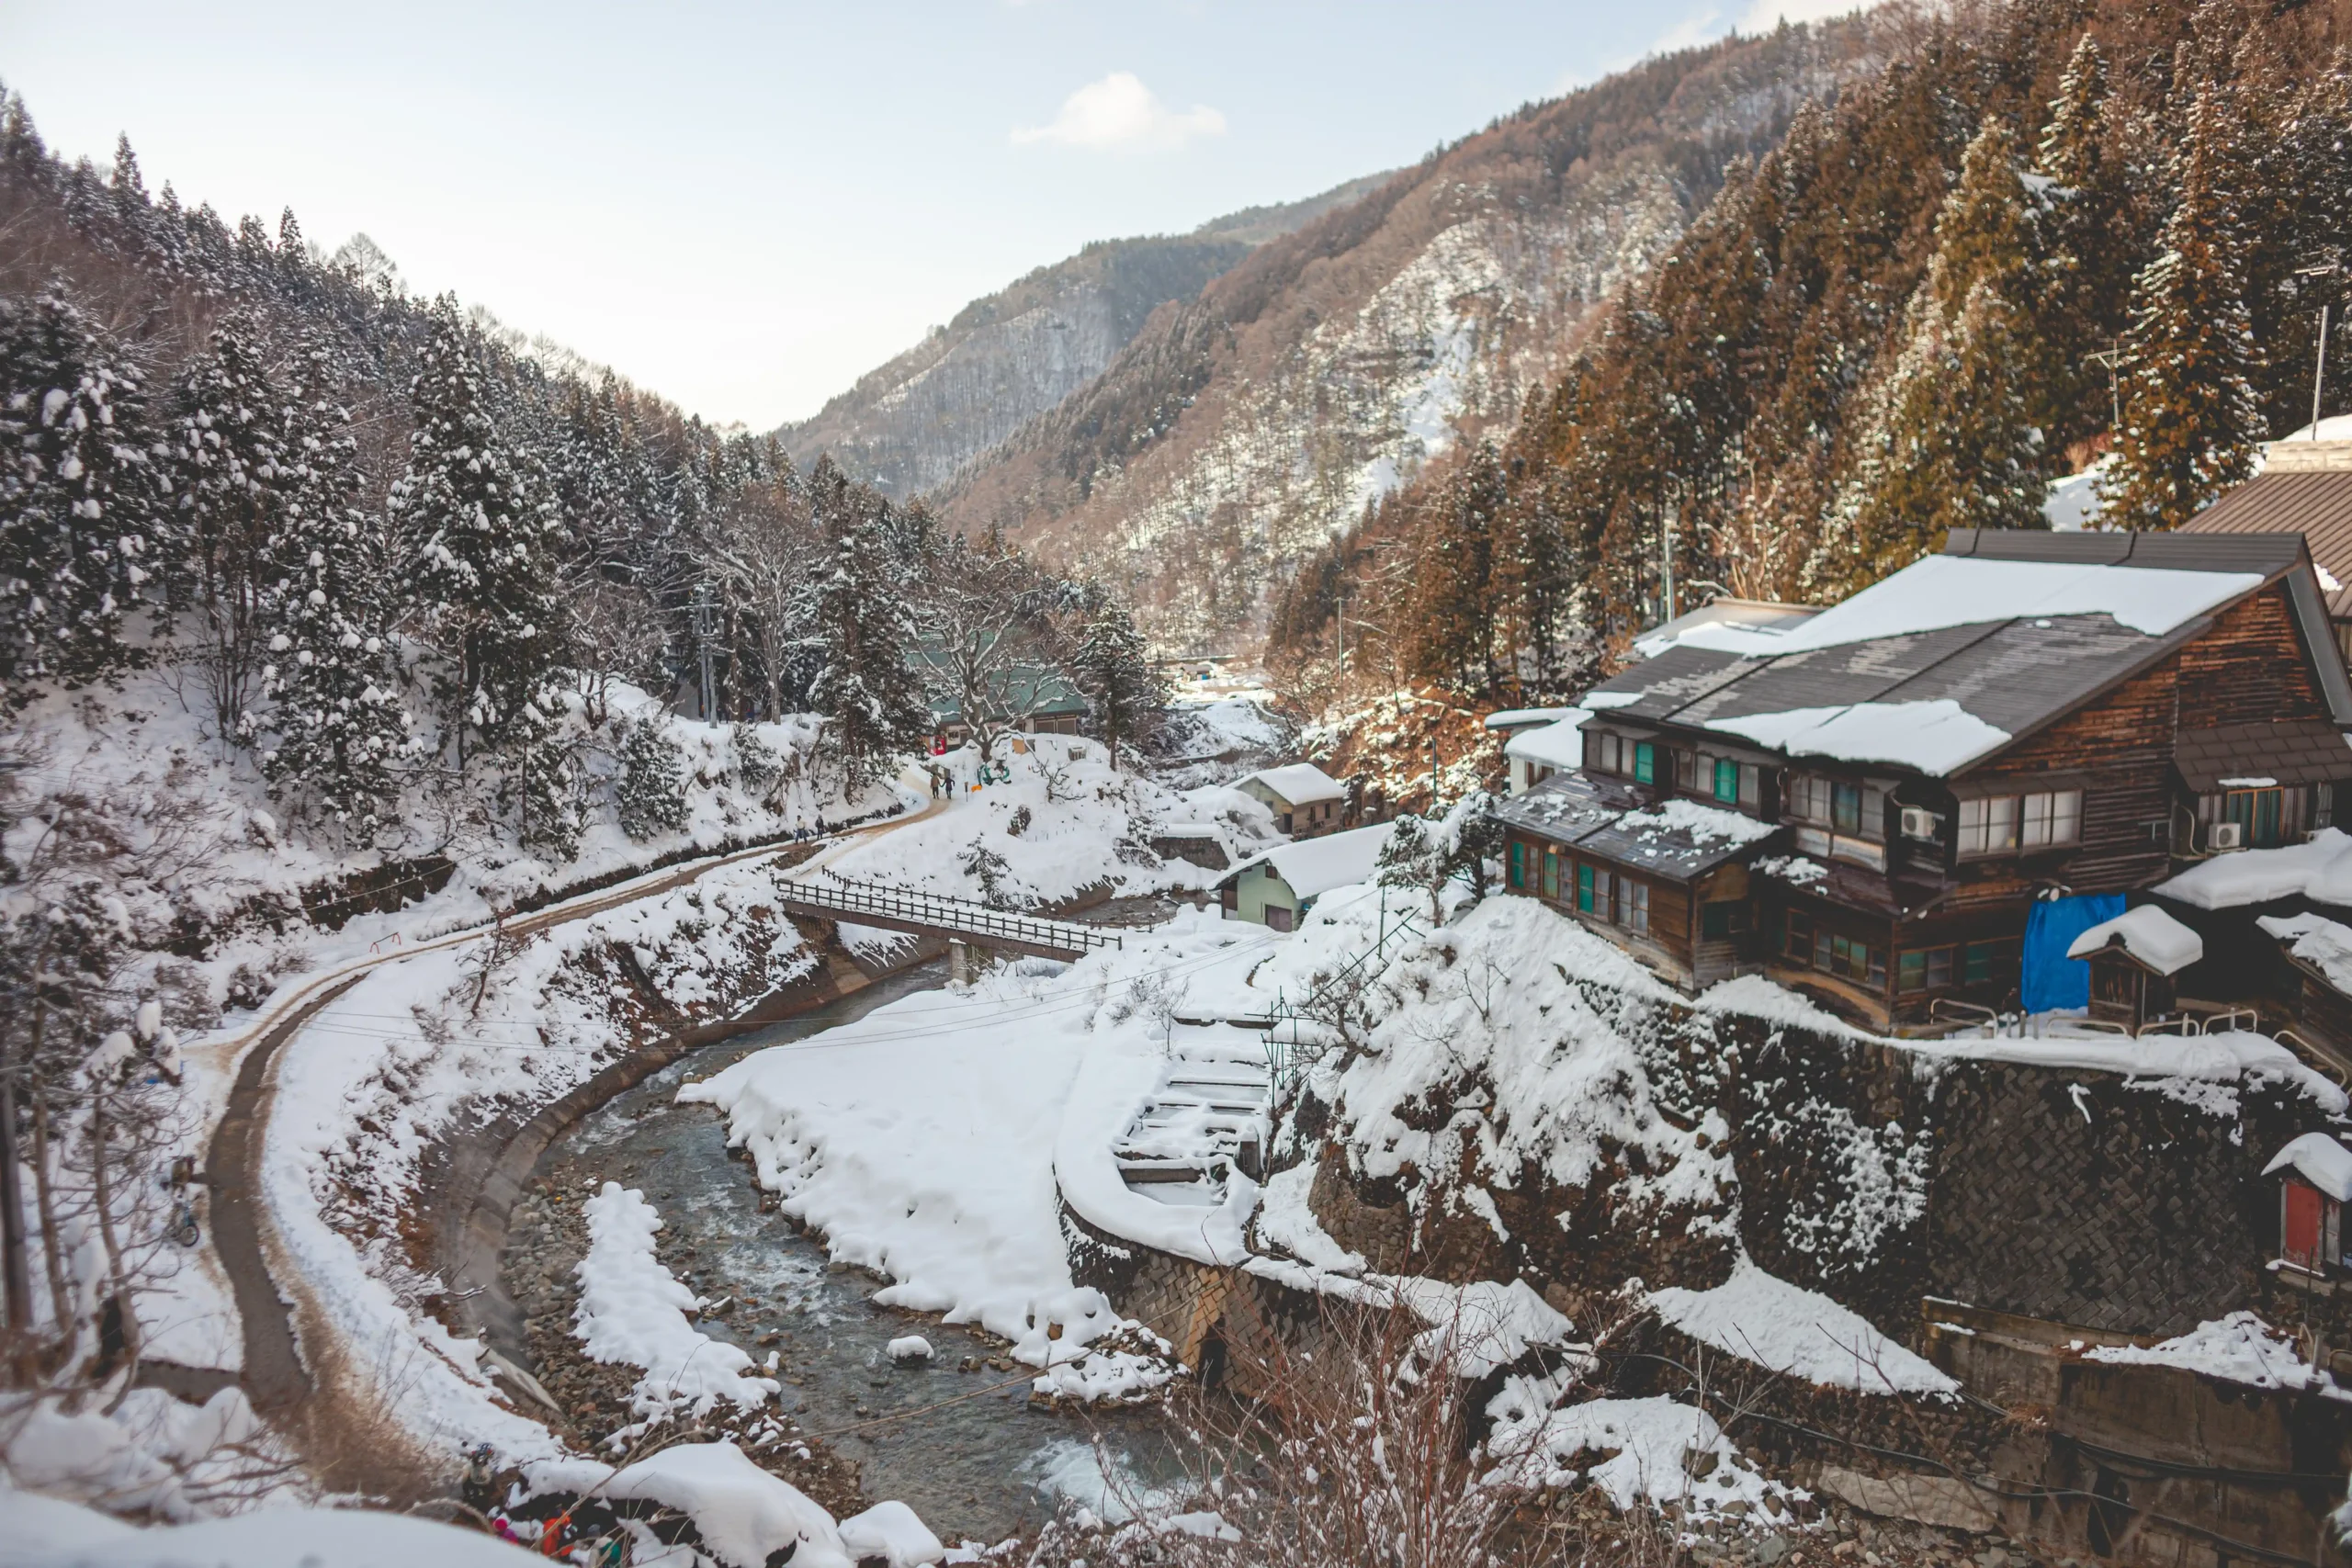
Worcester is New England’s overachiever. Located in central Massachusetts about 45 miles west of Boston, it sits at a higher elevation than the coast and is positioned to catch nor’easters before they track northeast and weaken. The result: Worcester consistently records 15–20 more inches of snow per season than Boston, despite being in the same state and often under the same storm system.
Nor’easters are Worcester’s defining winter feature. These coastal low-pressure systems develop off the Atlantic, draw in Gulf moisture, and track up the Eastern Seaboard, delivering heavy snow to the interior while the coast deals with surge and rain. Worcester is right in the snow zone. Some of the most damaging individual storms in New England history have produced 30+ inches in Worcester County in a single event. The February 2015 storm dropped 34.5 inches over two days. That’s not an outlier; it’s the kind of event Worcester’s winter profile makes possible.
The freeze-refreeze cycle is Worcester’s secondary problem. After a nor’easter, temperatures often drop sharply, and any melt refreezes into ice on sidewalks, roads, and stairs. The hazard lasts days longer than the storm itself. Central Massachusetts school districts learn to look past the storm total and think about what conditions will look like 48 hours after the snow stops, because that’s when ice becomes the real issue.
For families in Worcester, the nor’easter calendar is a predictable part of winter planning. Check your snow day probability the night before any coastal storm system and check it again after midnight, because Worcester’s elevation means it often picks up more accumulation than the forecast models initially project.
Snow season: November through April
Peak month: February
Closure risk: Moderate-High
US Snowfall Comparison Table
| # | City | Annual Avg (inches) | Peak Month | Snow Season | Closure Risk |
|---|---|---|---|---|---|
| 1 | Marquette, Michigan | 117″ | Nov–Dec | Oct–May | Very High |
| 2 | Sault Ste. Marie, Michigan | 116″ | Jan–Feb | Oct–Apr | Very High |
| 3 | Syracuse, New York | 114″ | Dec–Jan | Nov–Apr | Very High |
| 4 | Erie, Pennsylvania | 100″ | Nov–Dec | Nov–Apr | Very High |
| 5 | Flagstaff, Arizona | 100″ | Jan–Feb | Nov–Mar | High |
| 6 | Rochester, New York | 99″ | January | Nov–Apr | High |
| 7 | Buffalo, New York | 94″ | Dec–Jan | Nov–Mar | High |
| 8 | Duluth, Minnesota | 86″ | Jan–Feb | Oct–Apr | High |
| 9 | Anchorage, Alaska | 75″ | January | Oct–May | Moderate-High |
| 10 | Worcester, Massachusetts | ~70″ | February | Nov–Apr | Moderate-High |
When Does the US Get the Most Snow?
Snowfall timing varies considerably across these 10 cities — but the pattern breaks down clearly by storm mechanism.
October — Marquette and Sault Ste. Marie start accumulating meaningfully, with Lake Superior still warm enough to drive early lake-effect events. Anchorage and Duluth also begin their season.
November — The most explosive month for Lake Erie cities. Buffalo and Erie’s worst single events frequently arrive before December, when the lake is fully open. Lake-effect season off Ontario kicks into high gear for Syracuse and Rochester.
December — Peak intensity, broadly. All 10 cities on this list see their heaviest overall storm activity in the December through January 15 window. The Great Lakes are largely open, polar vortex dips bring repeated arctic air incursions, and the storm machine is running hard.
January — Consistent and relentless across the board. Coldest month for most of these cities. Snowpack builds continuously. Flagstaff sees its heaviest Pacific system impacts here.
February — Worcester and New England cities peak in February, when nor’easters are at their most frequent and intense. Great Lakes begin partial freeze-over, modestly reducing lake-effect intensity for Erie and Buffalo.
March — Transition month — but transition doesn’t mean quiet. Late-season storms are common and sometimes the worst of the year. Rochester and Syracuse can still receive significant accumulation. Duluth’s heavy snowfall often runs through mid-March.
April through May — Lingering snow in Marquette, Anchorage, and at altitude. Most other cities see their last significant snowfall by mid-April, though late-season events are possible anywhere on this list.
Great Lakes, Mountain West, and Northeast — Three Different Snow Stories
The 10 cities here don’t all experience winter the same way. The mechanism behind the snowfall is completely different depending on the region — and understanding that changes how you interpret a snow day forecast.
Great Lakes cities — Marquette, Sault Ste. Marie, Syracuse, Erie, Rochester, Buffalo, and Duluth — are all powered by lake-effect snow. Cold arctic air crosses open lake water, picks up heat and moisture, and then releases it rapidly when it hits land. The result is hyper-localised, intense snowfall in narrow bands. This is why Buffalo’s Southtowns can receive 60 inches in a storm while downtown Buffalo gets 6. Same storm. Same county. The band just landed differently.
Mountain West — Flagstaff’s snow comes from Pacific moisture systems moving east across the Southwest. The elevation does the work — at nearly 7,000 feet, temperatures stay cold enough to convert moisture that would fall as rain at lower elevations into heavy, sustained snowfall. No lake required.
Northeast — Worcester’s snowfall is nor’easter-driven: powerful coastal low-pressure systems that develop off the Atlantic and move northeast, delivering some of the largest single-storm totals in the US to interior New England. Less season-long consistency than the Great Lakes cities. More dramatic individual events.
Knowing which category your city falls into helps you understand not just how much snow to expect, but when to check, what to watch for, and how quickly conditions can escalate.
Check Your Snow Day Chances With Our Predictor
No matter which of these cities you live near, snowfall forecasts shift fast once a storm is in range. Our Snow Day Predictor gives you a real-time probability score for school closures in your specific ZIP code refreshed as NWS forecasts update through the evening.
Enter your ZIP code, get your percentage, and check again at 10 PM and midnight. For Great Lakes cities, this is especially important; lake-effect bands can set up or stall in ways that dramatically change accumulation projections in a matter of hours. The midnight check often looks nothing like the 8 PM check.
More winter context: see our breakdown of the snowiest cities in Colorado for how the Mountain West compares, and check our winter storm readiness guide before the next major storm reaches your area.
FAQ’s
Marquette, Michigan, averages approximately 117 inches of annual snowfall driven by lake-effect snow off Lake Superior. It’s a small city by national standards, but its NOAA snowfall record is clear. For large cities with 100,000+ residents, that title belongs to Syracuse, New York, at 114 inches.
Syracuse, New York — 114 inches per year, making it the snowiest US city with a population over 100,000. It’s held this title consistently across multiple decades of climate data, powered by lake-effect precipitation off the eastern end of Lake Ontario.
Marquette, Michigan at 117 inches annually. Anchorage, Alaska gets 75 inches but is not in the contiguous 48 states. For the continental United States only, Marquette is the answer.
Marquette, Michigan — 117 inches per year. For cities with populations over 100,000, the number one snowiest city in the US is Syracuse, New York at 114 inches. Both answers are correct depending on the population threshold you apply.
Yes — and the gap isn’t trivial. Flagstaff averages 100 inches annually; Buffalo averages 94. Flagstaff’s nearly 7,000-foot elevation on the Colorado Plateau drives its snowfall through orographic lift rather than lake-effect, but the result is comparable in total and makes it the snowiest city in the US west of the Mississippi River by a wide margin.
January is the peak month for most US cities — including Marquette, Syracuse, Rochester, Duluth, and Flagstaff. The exceptions: Erie and Buffalo tend to peak in November when Lake Erie is still fully open for lake-effect generation. Worcester, Massachusetts peaks in February during nor’easter season.
Use our free Snow Day Predictor tool to enter your ZIP code for an instant school closure probability based on live NWS weather data. Check between 9 PM and midnight the night before a storm for the most accurate result. Most districts in these snowbelt cities post closure decisions between 5 AM and 7 AM.
Accuracy improves significantly within 12 hours of a storm event, when NWS local forecasts reach their highest precision. For Great Lakes cities, Marquette, Syracuse, and Buffalo, especially lake-effect snow, introduce uncertainty because bands can stall unpredictably. Check multiple times throughout the evening to track how the probability moves as the overnight setup develops.